


 Introduction
Bar Graph highlights the salient features of the collected data, facilitate comparisons among two or more sets of data.
The candidate has to understand the given data and solution is to be obtained accordingly.
Quantitative Aptitude -BANKING|SSC|RAILWAYS|INSURANCE|RECRUITMENT EXAMS - EBOOKS
Methods
Bar graph: Presenting the given data in the form of horizontal and vertical bars by selecting a particular scale is called bar graph.
- One of the parameters is plotted on horizontal axis and the other on the vertical axis.
- The length of the bar shows the magnitude of the data, while its width is insignificant.
- Bars are arranged in time sequence or the size of the variable.
- The length of each bar depends upon the size of the items.
- In simple bar graphs only one category of data is shown.
- Different components of a total is represented.
- Bars are sub divided into a number component parts.
- Components are represented on percentage basis and it is like sub divided bar graph.
- All bars will be of same height.
- Used to highlight the relative importance of various components of the whole. Helpful to conclude the relative changes of the data.
- Two or more bars are represented, adjoining each other, to represent different components of a related variable.
- Length of each bar represents the magnitude of the data.
- Total bars of one set are continuous, are separated from other set by a gap.
- When the number of related variables is more than one or where changes in the actual values of the component figures are significant.
- This represents net quantities. For example net profit or loss, net of imports and exports, which have both negative and positive values.
- Bars are represented like positive deviations are above the base-line while negative deviations are below the base-line.
Samples
1. The data of the production of paper (in lakh tonnes) by three different companies X, Y and Z over the years are provided in the below bar graph. Read the graph carefully and answer the questions mentioned?
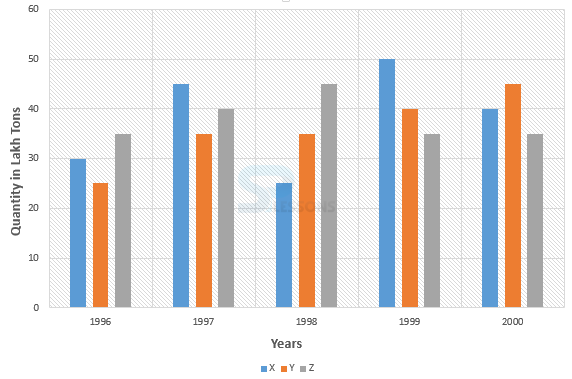 1. Which of the following years, the percentage rise/fall in production from the previous year is the maximum for company Y ?
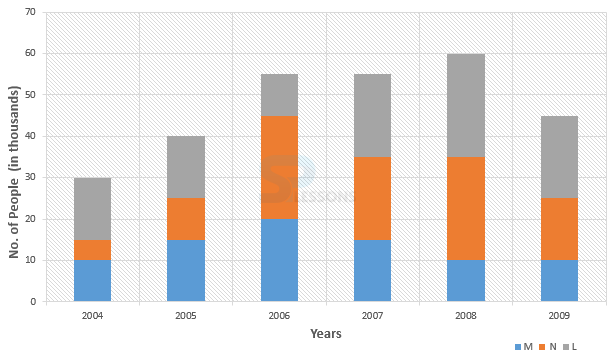 1. What is the average number of people using mobile service M for all the years together?
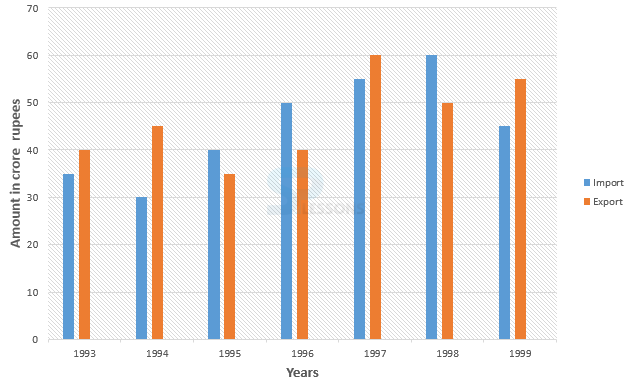 1. What is the ratio of total imports to the total exports for all the given years together?
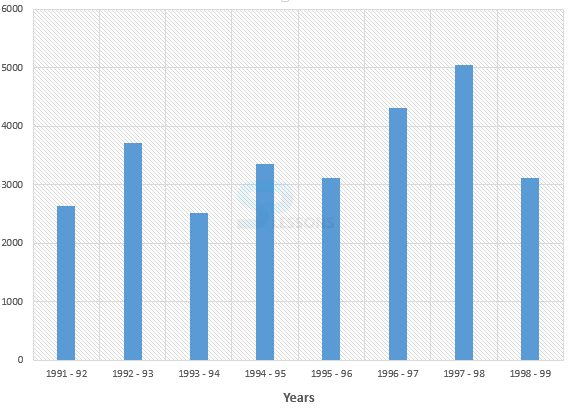 1. What was the percentage increase in the foreign exchange reserves in 1997-1998 over 1993-94?
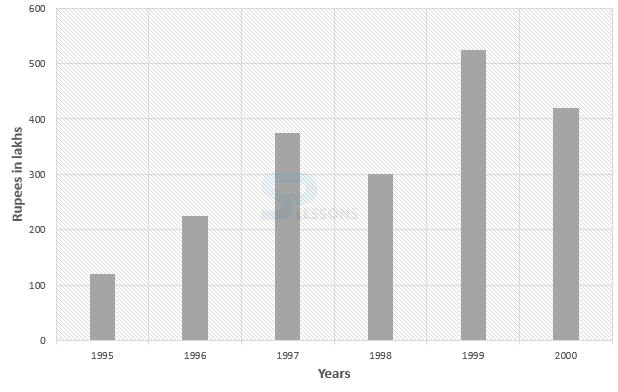 1. What was the difference between the average amount invested in raw materials during the given period and the average value of sales of finished goods during this period?
- (A) 1997
(B) 1998
(C) 1999
(D) 2000
(E) 1997 and 2000
- (A) 1 : 1
(B) 15 : 17
(C) 23 : 25
(D) 27 : 29
(E) None of these
- (A) 30%
(B) 45%
(C) 50%
(D) 60%
(E) 75%
- (A) 2,00,000 tons
(B) 20,00,000 tons
(C) 20,000 tons
(D) 2,00,00,000 tons
(E) None of these
- 1. Percentage change (rise/fall) in the production of company Y in the comparison to the previous year, for different years are:
In 1997 = [latex]\frac{(32 - 25)}{25} * 100[/latex]% = 40%
In 1998 = [latex]\frac{(35 - 35)}{25} * 100[/latex]% = 0%
In 1999 = [latex]\frac{(40 - 35)}{35} * 100[/latex]% = 14.29%
In 1997 = [latex]\frac{(50 - 40)}{40} * 100[/latex]% = 25%
Therefore, the maximum percentage rise/fall in the production of company Y is in 1997
So, option (A) is correct.
2. Average production of company X in the period 1998 - 2000 = [latex]\frac{1}{3} * (25 + 40 + 50)[/latex] =[latex]\frac{115}{3}[/latex] lakh tons.
Average production of company Y in the period 1998 - 2000 = [latex]\frac{1}{3} * (35 + 40 + 50)[/latex] =[latex]\frac{125}{3}[/latex] lakh tons.
Therefore, required ratio = [latex]\frac{\frac{115}{3}}{\frac{125}{3}}[/latex] = [latex]\frac{115}{125}[/latex]
So, option (C) is correct answer.
3. Percentage increase in the production of company Y from 1996 to 1999 = [latex]\frac{40 - 25}{25} * 100[/latex]% = [latex]\frac{15}{25} * 100[/latex]% = 60%
So, option (D) is correct answer.
4. Required difference = (45 - 25) x 100000 = 20,00,000 tons.
So, option (B) is the correct answer.
- (A) 16 [latex]\frac{2}{3}[/latex]
(B) 14444 [latex]\frac{1}{6}[/latex]
(C) 16666[latex]\frac{2}{3}[/latex]
(D) All of these.
(E) None of these.
- (A) 89.72
(B) 93.46
(C) 88.18
(D) 91.67
(E) None of these.
- (A) 8 : 7
(B) 3 : 2
(C) 19 : 13
(D) 15 : 11
(E) none of these.
- 1. Average number of people using mobile service = [latex]\frac{5 + 10 + 25 + 20 + 25 + 15}{6}[/latex] thousand
= [latex]\frac{100}{6}[/latex] thousand = 16666[latex]\frac{2}{3}[/latex]
2. The percent = 16666[latex]\frac{2}{3}[/latex] = 91.67
3.The ratio = 15 : 10 = 3 : 2
- (A) 31 : 35
(B) 35 : 31
(C) 65 : 63
(D) 63 : 65
(E) None of these.
- (A) 1994
(B) 1998
(C) 1997
(D) 1995
(E) None of these.
- 1. Total imports = 35 + 30 + 40 + 50 + 55 + 60 + 45 = 315 croes.
Total exports = 40 + 45 + 35 + 40 + 60 + 50 + 55 = 325crores.
Therefore, required ratio = 315 : 325 = 63 : 65
Hence, correct option is (D)
2. From the graph, the percentage rise in 1998 is the lowest.
Hence, correct option is (B)
- (A) 100
(B) 150
(C) 200
(D) 620
(E) 2520
- (A) 2 : 6
(B) 3 : 4
(C) 3 : 5
(D) 4 : 4
(E) 5 : 3
- 1. Foreign exchange reserves in 1997-98 = 5040 million US $
Foreign exchange reserves in 1993-94 = 2520 million US $
So, increase = 5040 - 2520 = 2520 million US $.
Therefore, percentage increase = [latex]\frac{2520}{2520} * 100[/latex]% = 100%
2. Average foreign exchange reserves over the given period = 3480 million US $.
The country had reserves above 3480 million US $ during the years 1992-93, 1996-97 and 1997-98 i.e. 3 years and below 3480 million US $ during the yeas 1991-92, 1993-94, 1994-95, 1995-96 and 1998-99 i.e. for 5 years.
Therefore, required ratio = 3 : 5.
- (A) Rs. 62.5 lakhs
(B) Rs. 68.5 lakhs
(C) Rs. 71.5 lakhs
(D) Rs. 77.5 lakhs
(E) Rs. 83.5 lakhs
- (A) 1996
(B) 1997
(C) 1998
(D) 1999
(E) 2000
- (A) 33%
(B) 37%
(C) 45%
(D) 49%
(E) 53%
- 1. Required difference = Rs. [latex]\frac{1}{6} * (2 + 300 + 500 + 400 + 600 + 460)[/latex] - [latex]\frac{1}{6}(120 + 225 + 375 + 330 + 525 + 420)[/latex] lakhs
= Rs. [latex]\frac{2460}{6}[/latex] - [latex]\frac{1995}{6}[/latex] lakhs
= Rs. (410 - 332.5) lakhs
= Rs. 77.5 lakhs.
So, correct option is (D).
2. The percentage increase in the amount invested in raw-materials as compared to the previous year, for different years are:
In 1996 = [latex]\frac{225 - 120}{120} * 100[/latex]% = 87.5%
In 1997 = [latex]\frac{375 - 225}{225} * 100[/latex]% = 66.67%
In 1998 there is decrease.
In 1999 = [latex]\frac{525 - 330}{330} * 100[/latex]% = 59.09%
In 2000 there is decrease.
Therefore, maximum % increase is in 1996.
So, the correct option is (A).
3. Required percentage = [latex]\frac{600}{375 + 330 + 525} * 100[/latex]% = 48.78% = 49%
So, the correct option is (D).