


 Introduction
GRE General Test Quantitative Reasoning is primarily categorized into the below-mentioned topics and GRE Quantitative Comparison is one of the categories. The GRE Quantitative Comparison category assesses the basic mathematical skills, understanding of the elementary mathematical concepts and ability to quantitatively reason and to model and solve problems with quantitative methods.
This article provides the detail information about the GRE Quantitative Comparison of GRE General Test.
- Arithmetic- The topics include properties and types of integers, such as divisibility, factorization, prime numbers, remainders and odd and even integers; arithmetic operations, exponents and roots; and concepts such as estimation, percent, ratio, rate, absolute value, the number line, decimal representation and sequences of numbers.
- Algebra- The topics include operations with exponents; factoring and simplifying algebraic expressions; relations, functions, equations and inequalities; solving linear and quadratic equations and inequalities; solving simultaneous equations and inequalities; setting up equations to solve word problems; and coordinate geometry, including graphs of functions, equations and inequalities, intercepts and slopes of lines.
- Geometry- The topics include parallel and perpendicular lines, circles, triangles - including isosceles, equilateral and 30°-60°-90° triangles - quadrilaterals, other polygons, congruent and similar figures, three-dimensional figures, area, perimeter, volume, the Pythagorean theorem and angle measurement in degrees. The ability to construct proofs is not tested.
- Data analysis- The topics include basic descriptive statistics, such as mean, median, mode, range, standard deviation, interquartile range, quartiles and percentiles; interpretation of data in tables and graphs, such as line graphs, bar graphs, circle graphs, boxplots, scatterplots and frequency distributions; elementary probability, such as probabilities of compound events and independent events; conditional probability; random variables and probability distributions, including normal distributions; and counting methods, such as combinations, permutations and Venn diagrams. These topics are typically taught in high school algebra courses or introductory statistics courses. Inferential statistics is not tested.
-
✦ Quantitative Comparison
✦ Single-Answer Multiple-Choice
✦ Multiple-Answer Multiple-Choice
✦ Numeric Entry
✦ Data Interpretation
Why QC
Why GRE Quantitative Comparison?
The GRE Quantitative Reasoning section evaluates the test taker skills in understanding the basic concepts of Arithmetic, Calculus, Geometry and other related topics. These questions are designed to test the test takers ability to solve the problems but not to test the mathematical knowledge. Following are the quantitative and reasoning skills tested in GRE quantitative Comparison :
- Understanding quantitative information
- Analyzing and data interpreting from quantitative information and including drawing an inference from a given dataset.
- Graphs and mathematical methods are used to solve the quantitative problems.
Q.Types
GRE Quantitative Comparison - Question Types
Questions of this type ask test taker to compare two quantities - Quantity A and Quantity B - and then determine which of the following statements describes the comparison.
- Quantity A is greater.
- Quantity B is greater.
- The two quantities are equal.
- The relationship cannot be determined from the information given.
Tips for QC
GRE Quantitative Comparison - Tips
- Become familiar with the answer choices. Quantitative Comparison questions always have the same answer choices, so get to know them, especially the last choice, "The relationship cannot be determined from the information given." Never select this last choice if it is clear that the values of the two quantities can be determined by computation. Also, if you determine that one quantity is greater than the other, make sure you carefully select the corresponding choice so as not to reverse the first two choices.
- Avoid unnecessary computations. Don't waste time performing needless computations in order to compare the two quantities. Simplify, transform or estimate one or both of the given quantities only as much as is necessary to compare them.
- Remember that geometric figures are not necessarily drawn to scale. If any aspect of a given geometric figure is not fully determined, try to redraw the figure, keeping those aspects that are completely determined by the given information fixed but changing the aspects of the figure that are not determined. Examine the results. What variations are possible in the relative lengths of line segments or measures of angles?
- Plug in numbers. If one or both of the quantities are algebraic expressions, you can substitute easy numbers for the variables and compare the resulting quantities in your analysis. Consider all kinds of appropriate numbers before you give an answer: e.g., zero, positive and negative numbers, small and large numbers, fractions and decimals. If you see that Quantity A is greater than Quantity B in one case and Quantity B is greater than Quantity A in another case, choose "The relationship cannot be determined from the information given."
- Simplify the comparison. If both quantities are algebraic or arithmetic expressions and you cannot easily see a relationship between them, you can try to simplify the comparison. Try a step-by-step simplification that is similar to the steps involved when you solve the equation 5 = 4x + 3 for x, or similar to the steps involved when you determine that the inequality [latex]\frac{3y + 2}{5}[/latex] < y is equivalent to the simpler inequality 1 < y. Begin by setting up a comparison involving the two quantities, as follows: Quantity A ? Quantity B where ? is a is a "placeholder" that could represent the relationship greater than (>), less than (<), or equal to (=) or could represent the fact that the relationship cannot be determined from the information given. Then try to simplify the comparison, step-by-step, until you can determine a relationship between simplified quantities. For example, you may conclude after the last step that '?' represents equal to (=). Based on this conclusion, you may be able to compare Quantities A and B.
Samples
Compare quantity A and quantity B, using additional information centered above the two quantities if such information is given, and select one of the following four answer choices:
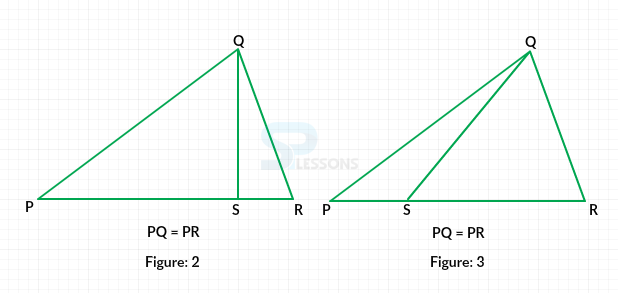 Note that Quantity A is greater in Figure 2 and Quantity B is greater in Figure 3.
Thus, the correct answer is Choice D, the relationship cannot be determined from the information given.
Note that Quantity A is greater in Figure 2 and Quantity B is greater in Figure 3.
Thus, the correct answer is Choice D, the relationship cannot be determined from the information given.
- A. Quantity A is greater.
B. Quantity B is greater.
C. The two quantities are equal.
D. The relationship cannot be determined from the information given.
| Quantity A | Quantity B |
|---|---|
| The least prime number greater than 24 | The greater prime number less than 28 |
-
A. Quantity A is greater.
B. Quantity B is greater.
C. The two quantities are equal.
D. The relationship cannot be determined from the information given.
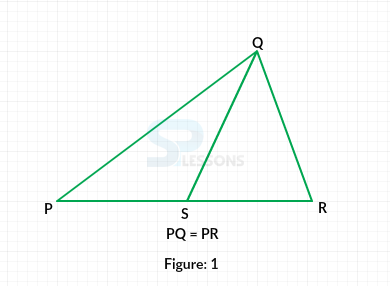
| Quantity A | Quantity B |
|---|---|
| PS | SR |
-
A. Quantity A is greater.
B. Quantity B is greater.
C. The two quantities are equal.
D. The relationship cannot be determined from the information given.