1. Study the following table and answer the given questions
| Time of expenditure/Year |
Salary |
Fuel and transport |
Bonus |
Interest on loans |
Taxes |
| 1998 |
288 |
98 |
3.00 |
23.4 |
83 |
| 1999 |
342 |
112 |
2.52 |
32.5 |
108 |
| 2000 |
324 |
101 |
3.84 |
41.6 |
74 |
| 2001 |
336 |
133 |
3.38 |
36.4 |
88 |
| 2002 |
420 |
142 |
3.96 |
49.4 |
98 |
1. The total amount of bonus paid by the Company during the given period is approximately what percent of the total amount of salary paid during this period?
2. Find the ratio between the total expenditure on taxes for all the years and the total expenditure on Fuel and Transport for all the years respectively ?
3. What is the average amount of interest per year which the Company had to pay during this period?
4. What is the total expenditure of the Company over these items during the year 2000 ?
5. Total expenditure on all these items in 1998 was approximately what percent of the total expenditure in 2002?
Solution:
1. Required percentage
= [latex]\frac{(3.00 + 2.52 + 3.84 + 3.68 + 3.96)}{(288 + 342 + 324 + 336 + 420)}[/latex] x 100%
= [latex]\frac{17}{1710}[/latex] x 100 % = 1 %
2. Required Ratio = [latex]\frac{(83 + 108 + 74 + 88 + 98)}{(98 + 112 + 101 + 133 + 142)}[/latex]
= [latex]\frac{451}{586}[/latex]
≅ [latex]\frac{1}{1.3}[/latex]
= [latex]\frac{10}{13}[/latex]
3. Average amount of interest paid by the Company during the given period
= Rs. [latex]\frac{(23.4 + 32.5 + 41.6 + 36.4 + 49.4)}{5}[/latex] lakhs
= Rs. [latex]\frac{183.3}{5}[/latex] lakhs
= Rs. 36.66 lakhs.
4. Total expenditure of the Company during 2000
= Rs. (324 + 101 + 3.84 + 41.6 + 74) lakhs
= Rs. 544.44 lakhs
5. Required percentage
= [latex]\frac{(288 + 98 + 3.00 + 23.4 + 83)}{(420 + 142 + 3.96 + 49.4 + 98)}[/latex] x 100 %
= [latex]\frac{495.4}{713.36}[/latex] x 100 % ≅ 69.45%
2. Study the following table carefully and answer the questions given below it:
The number of candidates appeared, passed and selected in a competitive examination from five states over the years.
A = Appeared P = Passed S = Selected
1. In the year 1995 which state had the lowest percentage of candidates selected over the candidates appeared?
2. During which of the following years the passing percentage over appeared is the highest from state D?
3. Total number of candidates selected from state A is approximately what percentage of the total number of candidates selected from state B?
4. During which of the following years the percentage of candidates selected over passed is the lowest for state B?
5. What is the ratio between number of candidates passed from state A in 1996 to that from state E in 1999?
Solution:
Given that,
The number of candidates appeared, passed and selected in a competitive examination from different States over the years.
1. Percentage of candidate selected over appeared.
| A |
B |
C |
D |
E |
| 2.94 |
3.33 |
2.82 |
3.33 |
3.57 |
2. Passing percentage over appeared for state D
| 1997 |
1998 |
1999 |
2000 |
| 28.14 |
26.66 |
27.02 |
25 |
3. Total no.of candidates selected from state A. = 25 + 20 + 22 + 36 + 32 + 28 = 163
Total no.of candidates selected from state B = 35 + 30 + 28 + 32 + 40 + 38 = 203
Required % = [latex]\frac{163}{203} \times 100[/latex] ≅ 80%
4. Percentage of candidates selected over passed for state B.
| 1995 |
1996 |
1998 |
2099 |
| 14.28 |
13.04 |
16.84 |
17.77 |
5. 240 : 280 = 6:7
3. The given table is listed about the number of boys and girls of different schools that have participated in a scholarship test over five years.
| School |
A |
B |
C |
D |
| Boys |
Girls |
Boys |
Girls |
Boys |
Girls |
Boys |
Girls |
| 2001 |
300 |
80 |
280 |
60 |
320 |
84 |
450 |
70 |
| 2002 |
320 |
70 |
300 |
80 |
424 |
100 |
320 |
60 |
| 2003 |
340 |
90 |
420 |
120 |
230 |
70 |
360 |
90 |
| 2004 |
370 |
100 |
480 |
140 |
360 |
120 |
500 |
120 |
1. In year 2004 the number of participating girls is what percent of number of participating boys?
2. Find the total number of participants in year 2003?
3. The percentage increase in participation of boys from school B in 2004 over those in 2001 is nearly ?
4. What is the ratio of boys and girls for school B over the years 2001-2004 ?
5. How many girls more participated in year 2004 as compared to 2003 for all schools taken together?
Solution:
Given that,
The number of boys and girls of different schools that have participated in a scholarship test over five years.
1. Number of girls participants in 2004 = 100 + 140 + 120 + 120 = 480
Number of boys participants in 2004 = 370 + 480 + 360 + 500 = 1710
Required ratio = 480 : 1710 = 16 : 57
2. Number of participation in 2003
= (340 + 90) + (420 + 120) + (230 + 70) + (360 + 90)
= 1720
3. Number of boys participants in 2004 from school B = 480
Number of boys participants in 2001 from school B = 280
Percentage increase = [latex]\frac{(480 - 280)}{280}[/latex] x 100% = 71%
4. Number of boys participants for school B = 280 + 300 + 420 + 480 = 1480
Number of girls participants for school B = 60 + 80 + 120 + 140 = 400
Required ratio = 1480 : 400 = 37 : 10
5. Number of girls participating in 2004 = 100 + 140 + 120 + 120 = 480
Number of girls participants in 2003 = 90 + 120 + 70 + 90 = 370
Required number = 480 - 370 = 110
4. Classification of 100 students based on the marks obtained by them in Physics and Chemistry in an examination. It is shown in below table:
| Marks out of 50/Subject |
40 and above |
30 and above |
20 and above |
10 and above |
0 and above |
| Physics |
9 |
32 |
80 |
92 |
100 |
| Chemistry |
4 |
21 |
66 |
81 |
100 |
| Average(Aggregate) |
7 |
27 |
73 |
87 |
100 |
Then, answer the folowing
1. What is the number of students scoring less than 40% marks in aggregate ?
2. If at least 60% marks in Physics are required for pursuing higher studies in Physics, how many students will be eligible to pursue higher studies in Physics?
3. What is the difference between the number of students passed with 30 as cut-off marks in Chemistry and those passed with 30 as cut-off marks in aggregate?
4. Approximately what is the percentage of the number of students getting at least 60% marks in Chemistry over those getting at least 40% marks in aggregate?
5. If it is known that at least 23 students were eligible for a Symposium on Chemistry, what is the minimum qualifying marks in Chemistry for eligibility to Symposium would lie in the range?
Solution:
1. 40% of 50 = ([latex]\frac{40}{100}[/latex] x 50) = 20
Required number = Number of students scoring less than 20 marks in aggregate
= 100 - number of students scoring 20 and above marks in aggregate
= 100 - 73 = 27.
2. 60% of 50 = ([latex]\frac{60}{100}[/latex] x 50) = 30
Required number = Number of students scoring 30 and above marks in Physics = 32.
3. Required difference = (Number of students scoring 30 and above marks in Chemistry) - (Number of students scoring 30 and above marks in aggregate)
= 27 - 21 = 6
4. Number of students getting at least 60% marks in Chemistry = Number of students getting 30 and above marks in chemistry = 21.
Number of students getting at least 40% marks in aggregate = Number of students getting 20 and above marks in aggregate = 73.
Required Percentage = ([latex]\frac{21}{73}[/latex] x 100)% = 28.77% = 29%.
5. Since 66 students get 20 and above marks in Chemistry and out of these 21 students get 30 and above marks, therefore to select top 35 students in Chemistry, the qualifying marks should lie in the range 20-30.


 Introduction
 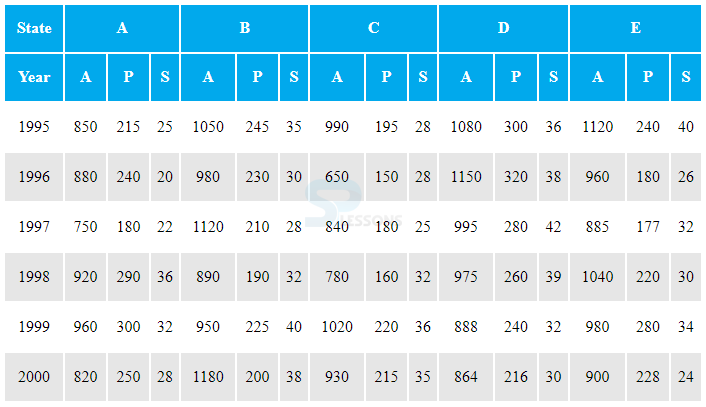 A = Appeared P = Passed S = Selected
1. In the year 1995 which state had the lowest percentage of candidates selected over the candidates appeared?
2. During which of the following years the passing percentage over appeared is the highest from state D?
3. Total number of candidates selected from state A is approximately what percentage of the total number of candidates selected from state B?
4. During which of the following years the percentage of candidates selected over passed is the lowest for state B?
5. What is the ratio between number of candidates passed from state A in 1996 to that from state E in 1999?
Solution:
A = Appeared P = Passed S = Selected
1. In the year 1995 which state had the lowest percentage of candidates selected over the candidates appeared?
2. During which of the following years the passing percentage over appeared is the highest from state D?
3. Total number of candidates selected from state A is approximately what percentage of the total number of candidates selected from state B?
4. During which of the following years the percentage of candidates selected over passed is the lowest for state B?
5. What is the ratio between number of candidates passed from state A in 1996 to that from state E in 1999?
Solution: