


 Introduction
What is data interpretation?
Data Interpretation or DI refers to the implementation of procedures through which data is reviewed for the purpose of arriving at an inference. Data can be obtained from multiple sources.
Example: data from running of industries, census population data etc.
Data Interpretation is one of important topic in Quantitative Aptitude Section. In Data Interpretation Quiz 16 article candidates can find questions with answer. By solving this questions candidates can improve and maintain, speed, and accuracy in the exams. Data Interpretation Quiz 16 questions are very useful for different exams such as IBPS PO, Clerk, SSC CGL, SBI PO, NIACL Assistant, NICL AO, IBPS SO, RRB, Railways, Civil Services etc.
Direction(1-5): Read the table carefully and answer the related questions to etc. The above table represents the population of a certain city.
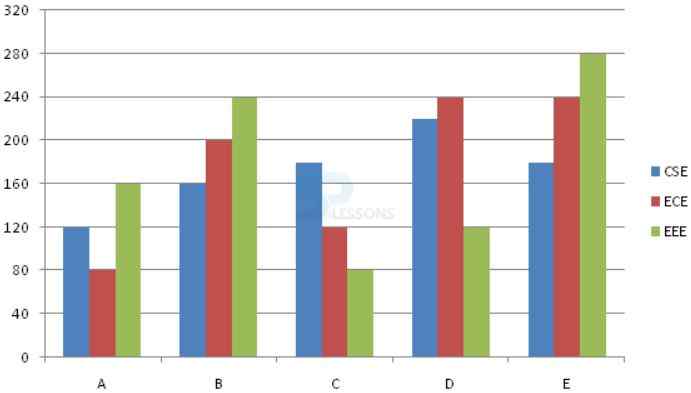
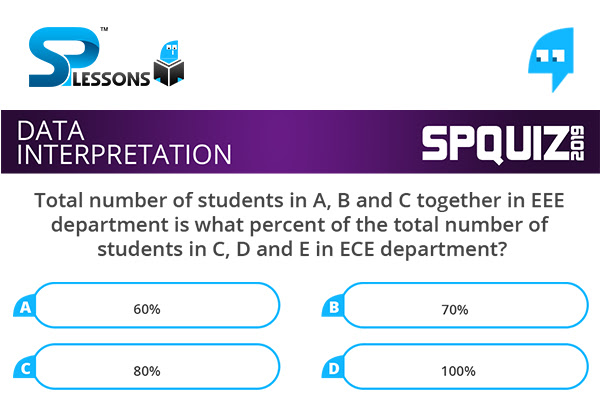
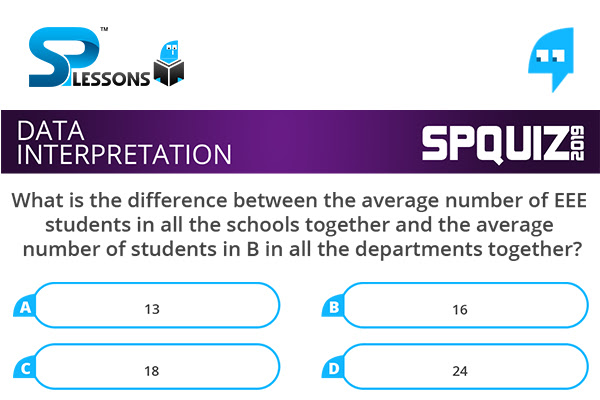
The given bar graph shows the number of students in different colleges in three different departments in 2018.
Q1
Total number of students in A, B and C together in EEE department is what percent of the total number of students in C, D and E in ECE department?
- A. 60%
B. 70%
C. 80%
D. 100%
Required percentage = [latex]\frac {(160 + 240 + 80)}{(120 + 240 + 240)} \times 100[/latex]
= 80%
Q2
What is the difference between the average number of EEE students in all the schools together and the average number of students in B in all the departments together?
- A. 13
B. 16
C. 18
D. 24
Average number of EEE students = [latex]\frac {(160 + 240 + 80 + 120 + 280)}{5}[/latex] = 176
Average number of students in B = [latex]\frac {(160 + 200 + 240)}{3}[/latex] = 200
Difference = 200 – 176 = 24
Q3
The total number of students in ECE departments in all the colleges together is approximately what percent of the total number of students in C and D together in all the departments together?
- A. 88%
B. 92%
C. 78%
D. 86%
Total students in ECE department = 80 + 200 + 120 + 240 + 240 = 880
Total students in C and D = 180 + 120 + 80 + 220 + 240 + 120 = 960
Required percentage = [latex]\frac {880}{960} \times 100 = 92[/latex]%
Q4
What is the ratio of the total number of students in CSE department in all the colleges together to total number of students in E in all the departments together?
- A. 43 : 35
B. 41 : 35
C. 45 : 37
D. 43 : 32
Required ratio = (120 + 160 + 180 + 220 + 180): (180 + 240 + 280)
= 860: 700
= 43 : 35
Q5
What is the difference between the total number of students in A and C in all the departments together?
- A. 10
B. 15
C. 20
D. 25
Number of students in A = 120 + 80 + 160 = 360
Number of students in C = 180 + 120 + 80 = 380
Difference = 380 – 360 = 20