1. A Professor, Dr. Kusum, takes a number of mock exams for a course. All the mock exams are out of 100. A student can get an A grade in the course if the average of her scores is more than or equal to 90. Grade B is awarded to a student if the average of her scores is between 87 and 89 (both included). If the average is below 87, the student gets a C grade. Suresh is preparing for the last exam and he realizes that he will score a minimum of 97 to get an A grade. After the exam, he realizes that he will score 70, and he will just manage a B. How many mock exams did Dr. Kusum take?
A. 6
B. 7
C. 8
D. 9
E. None of these
Answer: D
2. What is the sum of the following series?
—74, —76, —78, .... .... ...., —100
A. —1258
B. —1218
C. —1268
D. —1264
E. None of the above
Answer: B
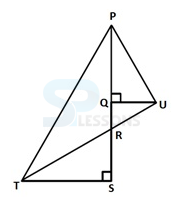
3. In the diagram below, RS = QU = 10 units and [latex]\angle[/latex]RTS = [latex]\angle[/latex]QPU = 30°. What would be the area of ∆PTS? (Note: Diagram below may not be proportional to scale.)
A. 100([latex]\sqrt{2}[/latex] + 3)
B. [latex]\frac{100}{(\sqrt{3} + 4)}[/latex]
C. [latex]\frac{50}{(\sqrt{3} + 4)}[/latex]
D. 50([latex]\sqrt{3}[/latex])
E. None of the above
Answer: D
4. Two diagonals of a parallelogram intersect each other at coordinates (18.5, 24.5). Two adjacent points of the parallelogram are (6.5, 8.5) and (14.5, 17). Find the lengths of the diagonals.
A. 15 and 30
B. 15 and 40
C. 17 and 30
D. 17 and 40
E. Multiple solutions are possible
Answer: D
5. Charlie plans to order a wedding gift for her friend from an e-retailer. However, the wedding coincides with the Christmas season during which demand for buying online goods is huge and hence deliveries are often delayed. He estimates that the probability of receiving the wedding gift, in time, from the e-retailers P, Q, R and S would be 0.6, 0.8, 0.9 and 0.5 respectively. Playing safe, he orders from all four e-retailers simultaneously. What would be the probability that her friend would receive the wedding gift in time?
A. 0.004
B. 0.006
C. 0.216
D. 0.994
E. 0.996
Answer: E
6. The figure below has been obtained by folding a rectangle. The total area of the figure (as visible) is 256 square meters. Had the rectangle not been folded, the current overlapping part would have been a square. What would have been the total area of the original unfolded rectangle?
A. 228 square meters
B. 254 square meters
C. 288 square meters
D. 272 square meters
E. None of the above
Answer: C
Direction(7 – 10): Given below is the data of production and consumption of wheat (in tonnes) in India during the given time period. (Production + Import = Consumption + Export + change in closing stock)
| Year |
Consumption |
Export |
Import |
(-) and (+)
in Closing Stock |
| 2001 - 2002 |
350480 |
816 |
19,940 |
7015 |
| 2002 - 2003 |
385850 |
1861 |
8093 |
(7465) |
| 2003 - 2004 |
425465 |
1030 |
51635 |
33640 |
| 2004 - 2005 |
461765 |
1498 |
19770 |
4120 |
| 2005 - 2006 |
471820 |
1315 |
32070 |
39990 |
| 2006 - 2007 |
491545 |
1740 |
29534 |
40665 |
| 2007 - 2008 |
528110 |
5889 |
20207 |
4605 |
| 2008 - 2009 |
531475 |
12356 |
8572 |
(8580) |
7. Calculate the total amount of import during the year?
A. 201786
B. 198456
C. 214786
D. 189821
E. None of the above
Answer: D
8. Calculate the average quantity of production from the year 2001-2002 to 2003- 2004?
A. 379001
B. 410567
C. 373008
D. 372153
E. None of these
Answer: C
9. What is the respective ratio of average export and average import during the period?
A. 331 : 2373
B. 378 : 3456
C. 371 : 3456
D. 361 : 2871
E. None of the above
Answer: A
10. Find the approximate percentage growth in the quantity of the export during the entire period?
A. 87
B. 93
C. 96
D. 95
E. None of the above
Answer: B


 Introduction