


 Introduction
What is data interpretation?
Data Interpretation or DI refers to the implementation of procedures through which data is reviewed for the purpose of arriving at an inference. Data can be obtained from multiple sources.
Example: data from running of industries, census population data etc.
Data Interpretation is one of important topic in Quantitative Aptitude Section. In Data Interpretation Quiz 12 article candidates can find questions with answer. By solving this questions candidates can improve and maintain, speed, and accuracy in the exams. Data Interpretation Quiz 12 questions are very useful for different exams such as IBPS PO, Clerk, SSC CGL, SBI PO, NIACL Assistant, NICL AO, IBPS SO, RRB, Railways, Civil Services etc.
Direction(1-5): Below Pie charts gives the information of company - Pk Diamonds Ltd. for the sales of two years 2014 & 2015 . Based on these charts answer the questions that follows-
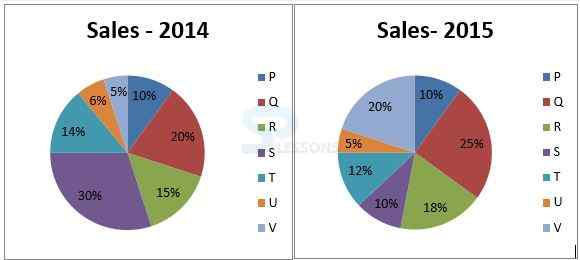
Total Sales In 2014 – $ 12000 Total sales in 2015 - $ 18000
Q1
What is the percentage increase in the sales of the company in the period 2014 to 2015?

- A. 25%
B. 50%
C. 14%
D. 78%
As given Sales in 2014 = 12000
Sales in 2015 – 18000
So, increase is [latex]\Rightarrow \frac {6000}{12000} = 0.5 \times 100 = 50%[/latex]
Q2
Which product has shown the highest increase in the sales from 2014 to 2015 ?

- A. P
B. Q
C. R
D. V
AS from 2014 to 2015 there is increase of 50 % So,
100 [latex]\Rightarrow[/latex] 150
V in 2014 = 5% of 12000 = 600
V in 2015= 20% of 18000 = 3600
So % increase = [latex]\frac {3600 × 100}{600} [/latex]= 600%
So V has the highest increase of 600%
Q3
What is the difference between the sales of Q in 2015 to 2014?
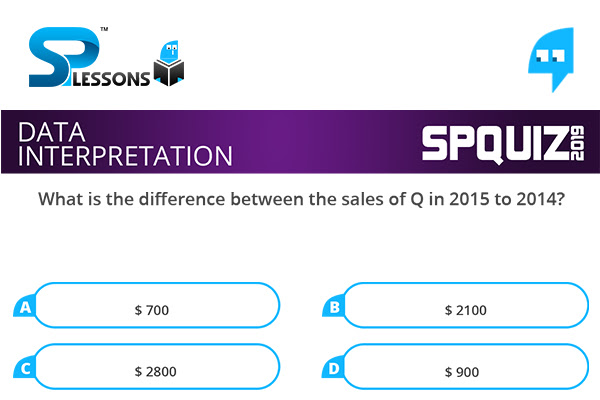
- A. $ 700
B. $ 2100
C. $ 2800
D. $ 900
IN 2014 the number of products of Q is [latex]\Rightarrow \frac {20 \times 12000} {100} = 2400[/latex]
In 2015 [latex]\Rightarrow \frac {25 \times 18000}{100} = 4500[/latex]
So, difference is [latex]4500 - 2400 = 2100 [/latex]
Q4
For how many products did the sales increase by more than 40% from 2014 to 2015?
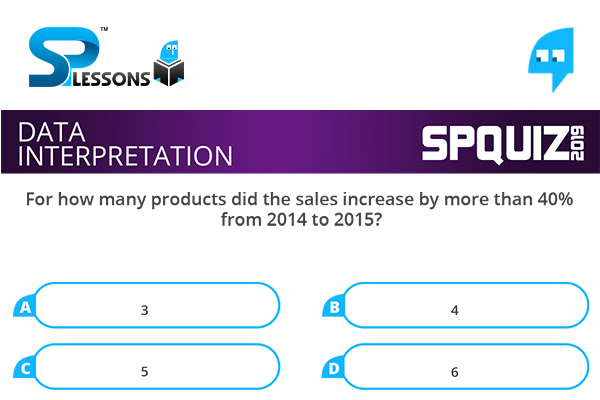
- A. 3
B. 4
C. 5
D. 6
AS calculated the iNcrease in sales from 2014to 2015 is 50%
So, 100 [latex]\Rightarrow 150[/latex]
Now calculate for P, Q ,R ……
The sales Increase by 40 % for these products --.
P, Q,R,V
Q5
How much is the total sales for S for both years 2014 & 2015?

- A. $ 5400
B. $ 5000
C. $ 4200
D. $ 3000
For year 2014 [latex]\Rightarrow \frac {30 \times 12000}{100} = $3600[/latex]
For year 2015 [latex]\Rightarrow \frac {10 \times 18000}{100} = 1800[/latex]
So, total sales of S is [latex]\rightarrow 3600 + 1800 = 5400[/latex]