


 Introduction
What is data interpretation?
Data Interpretation or DI refers to the implementation of procedures through which data is reviewed for the purpose of arriving at an inference. Data can be obtained from multiple sources.
Example: data from running of industries, census population data etc.
Data Interpretation is one of important topic in Quantitative Aptitude Section. In Data Interpretation Quiz 13 article candidates can find questions with answer. By solving this questions candidates can improve and maintain, speed, and accuracy in the exams. Data Interpretation Quiz 13 questions are very useful for different exams such as IBPS PO, Clerk, SSC CGL, SBI PO, NIACL Assistant, NICL AO, IBPS SO, RRB, Railways, Civil Services etc.
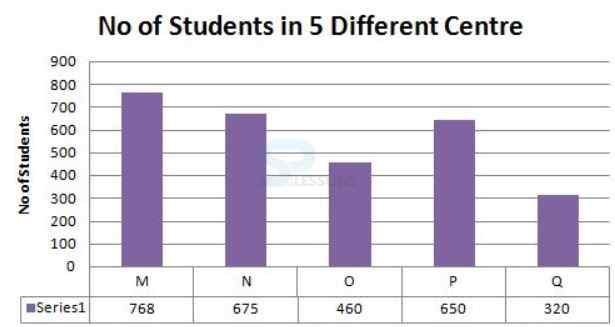
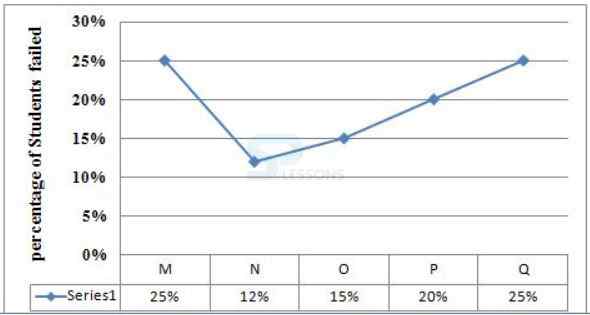
Direction(1-5): Study the following graph carefully and answer the following questions given below.
Q1
If the ratio of number of boys & girls are in the ratio 3:2 in N and P, find the average number of boys in N and P together ?
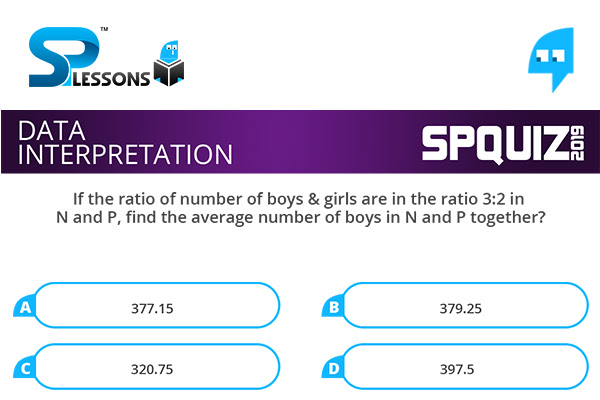
- A. 377.15
B. 379.25
C. 320.75
D. 397.5
N : 675 [latex]\Rightarrow Boys = 675 \times \frac {3}{5} = 405[/latex]
P : 650 [latex]\Rightarrow Boys = 650 \times \frac {3}{5} = 390[/latex]
Avg = [latex]405 + \frac {390}{2} = 397.5[/latex]
Q2
Find the total no of failed students in M, O and Q together ?

- A. 247
B. 330
C. 341
D. 430
M = [latex]768 \times 25% = 192[/latex]
O = [latex]460 \times 15% = 69[/latex]
Q = [latex]320 \times 25% = 80[/latex]
Total = 341
Q3
What will be the ratio of number of boys passed in N to number of girls failed in N, if the number of girls and boys in the ratio 16:11 ?

- A. 121 : 24
B. 7 : 11
C. 103 : 529
D. 21 : 37
675 [latex]\Rightarrow 400 : 275 \Rightarrow 16 : 11 = G:B[/latex]
[latex] G : 400 \times 12% = 48[/latex]
[latex]B : 275 \times 88% = 242[/latex]
242 : 48 = 121 : 24
Q4
Find the difference between the number of passed students in Q to number of failed students in M ?
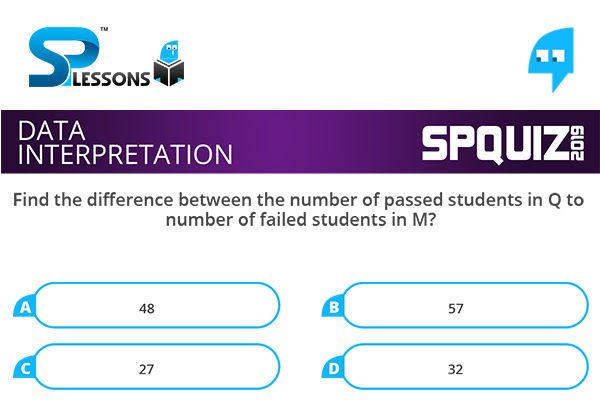
- A. 48
B. 57
C. 27
D. 32
Q Passed [latex]\Rightarrow 75% of 320 = 240[/latex]
M failed [latex]\Rightarrow 192[/latex]
Difference = 240 - 192 = 48
Q5
Which centre has the second least number of failed student ?
- A. M
B. P
C. O
D. Q
M = 192
N = 81
O = 69
P = 130
Q = 80