


 Introduction
What is data interpretation?
Data Interpretation or DI refers to the implementation of procedures through which data is reviewed for the purpose of arriving at an inference. Data can be obtained from multiple sources.
Example: data from running of industries, census population data etc.
Data Interpretation is one of important topic in Quantitative Aptitude Section. In Data Interpretation Quiz 17 article candidates can find questions with answer. By solving this questions candidates can improve and maintain, speed, and accuracy in the exams. Data Interpretation Quiz 17 questions are very useful for different exams such as IBPS PO, Clerk, SSC CGL, SBI PO, NIACL Assistant, NICL AO, IBPS SO, RRB, Railways, Civil Services etc.
Direction(1-5): Study the following information carefully and answer the given questions:
The following table shows the total number of birthday cakes sold by 5 different bakeries in 4 different months.
| Months | P | Q | R | S | T |
|---|---|---|---|---|---|
| January | 280 | 320 | 250 | 300 | 360 |
| February | 220 | 270 | 210 | 370 | 190 |
| March | 260 | 330 | 340 | 240 | 250 |
| April | 340 | 230 | 380 | 260 | 300 |
Q1
Find the difference between the total number of cakes sold by bakery R and T together on January to that of total number of cakes sold by bakery P and S together on April?
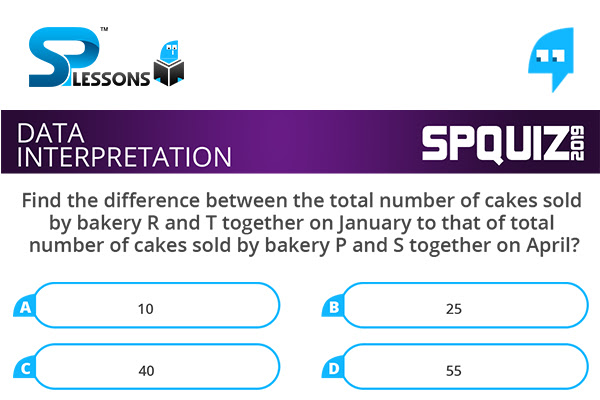
- A. 10
B. 25
C. 40
D. 55
The total number of cakes sold by bakery R and T together on January
[latex]\Rightarrow 250 + 360 = 610[/latex]
The total number of cakes sold by bakery P and S together on April
[latex]\Rightarrow 340 + 260 = 600[/latex]
Required difference = 610 – 600 = 10
Q2
Find the average number of cakes sold by bakery P on all the given months together?
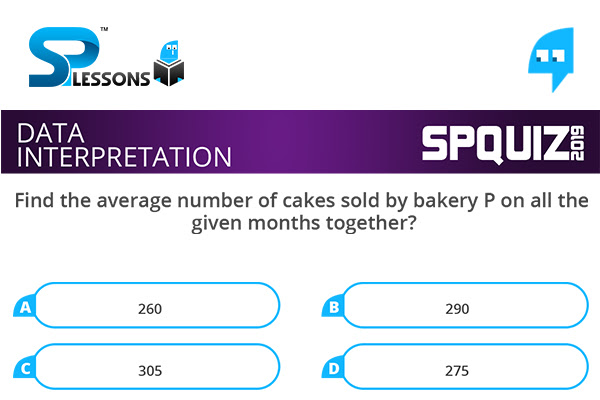
- A. 260
B. 290
C. 305
D. 275
The average number of cakes sold by bakery P on all the given months together
[latex]\Rightarrow \frac {(280 + 220 + 260 + 340)}{4}[/latex]
[latex]\Rightarrow \frac {1100}{4} = 275[/latex]
Q3
Find the ratio between the total number of cakes sold by bakery Q on January and March together to that of total number of cakes sold by bakery S on March and April together?
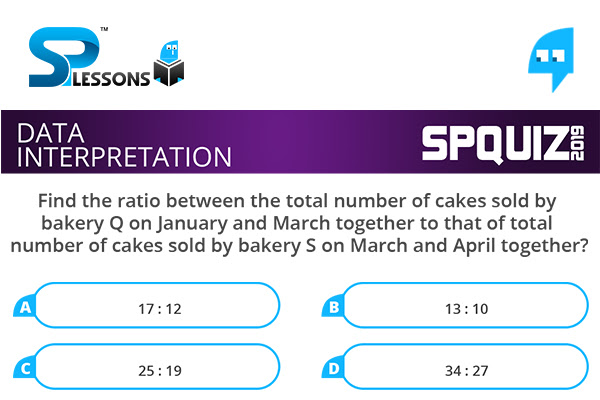
- A. 17 : 12
B. 13 : 10
C. 25 : 19
D. 34 : 27
The total number of cakes sold by bakery Q on January and March together
[latex]\Rightarrow 320 + 330 = 650[/latex]
The total number of cakes sold by bakery S on March and April together
[latex]\Rightarrow 240 + 260 = 500[/latex]
Required ratio = 650 : 500 = 13 : 10
Q4
Total number of cakes sold by bakery P, Q and R together on February is approximately what percentage of total number of cakes sold by bakery R, S and T together on March?
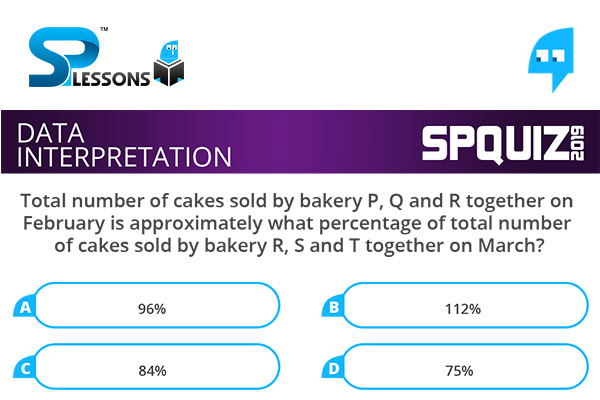
- A. 96%
B. 112%
C. 84%
D. 75%
Total number of cakes sold by bakery P, Q and R together on February
[latex]\Rightarrow 220 + 270 + 210 = 700[/latex]
Total number of cakes sold by bakery R, S and T together on March
[latex]\Rightarrow 340 + 240 + 250 = 830[/latex]
Required % = [latex](\frac {700}{830}) \times 100 = 84.33 % = 84 %[/latex]
Q5
If the total number of cakes sold by bakery P on May is 20 % more than the average number of cakes sold by bakery P on all the given months together, find the total number of cakes sold by bakery P on May?
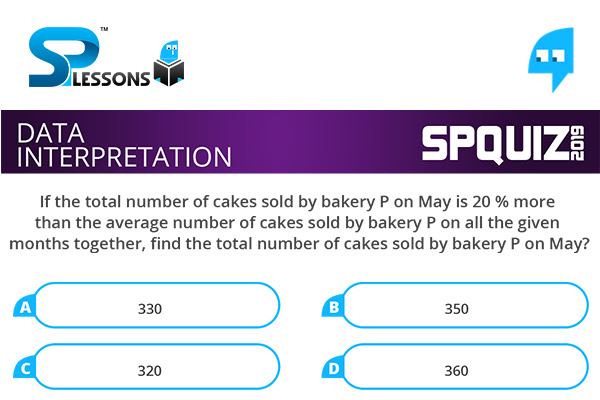
- A. 330
B. 350
C. 320
D. 360
The total number of cakes sold by bakery P on May
[latex]\Rightarrow [\frac {(280 + 220 + 260 + 340)}{4}] \times (\frac {120}{100})[/latex]
[latex]\Rightarrow (\frac {1100}{4}) \times (\frac {6}{5})[/latex]
[latex]\Rightarrow 330[/latex]