Quantitative Aptitude - SPLessons

Data Interpretation Questions | IBPS Clerk Prelims & Mains

Home > > Tutorial
SPLessons 5 Steps, 3 Clicks
5 Steps - 3 Clicks

Data Interpretation Questions | IBPS Clerk Prelims & Mains

shape Introduction

Data Interpretation Questions test the ability to analyze, interpret and visualize the provided data to arrive at conclusions and to make inferences. Data Interpretation questions in the competitive exams is a test of analytical abilities. In the competitive exams, the Data Interpretation questions are grouped together and refer to the same table, graph or other data/visual presentation. IBPS Clerk aspirants can practice the below questions for improving calculation speed and accuracy.

shape Practice Sets

Directions for Questions (1 – 5): The following table shows number of students who applied for the various posts for RRB India having different qualifications. Study the table carefully and answer the questions that follow.
In table some data are missing. Find the missing data first if it is required in any question and then proceed.

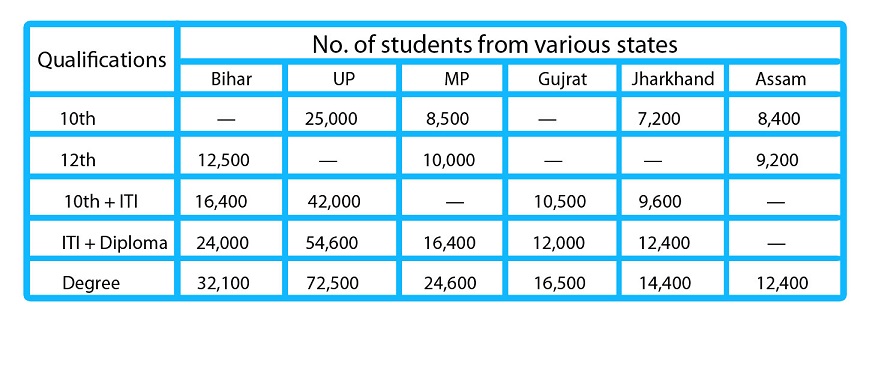
No. of students having different qualifications is independent from each-other Don’t treat any student may have more than one qualification unless it is not mentioned in questions.
Q1. If only 10th pass students are eligible for group-D exam then total number of students who applied for group-D exam from Bihar is what percent of total number of students who have qualification of degree from MP and Jharkhand together? It is given that total number of students from Bihar who applied for various posts in RRB is 95,500.
    A. 13[latex] \frac{12} {13}[/latex]% B. 26[latex] \frac{12} {13}[/latex]% C. 24[latex] \frac{12} {13}[/latex]% D. 22[latex] \frac{12} {13}[/latex]% E. 23%

Answer: Option B
Solution:
No. of students from Bihar having 10th qualification
= 95,500 – (12,500 + 16,400 + 24,000 + 32,100) = 10,500
∴ Required percentage
= [latex] \frac{10,500} {24,600 + 14,400}[/latex] x 100
= [latex] \frac{10,500} {390}[/latex]
= [latex] \frac{350} {13}[/latex]
= 26[latex] \frac{12} {13}[/latex]%
Q2. If only degree holders are eligible for ALP post then find the average number of students who have applied for ALP post from all the states together.
    A. 26,750 B. 28,450 C. 27,850 D. 28,750 E. 27,580

Answer: Option D
Solution:
Required average number of students
= [latex] \frac{1} {6}[/latex] x (32,100 + 72,500 + 24,600 + 16,500 + 14,400 + 12,400)
= [latex] \frac{1} {6}[/latex] x 1,72,500
= 28,750
Q3. According to RRB, only those candidates who have qualification of both ITI & higher qualification can apply for the post of Technician then find the total number of students who has applied for the post of Technician from all the states together. It is given that the number of students who have (ITI + Diploma) qualification from Assam is 45% of number of students from Bihar having same qualifications as that of students from Assam.
    A. 90,400 B. 87,500 C. 95,400 D. Can’t be determined E. 1,30,200

Answer: Option E
Solution:
24000 + 54600 + 16400 + 12000 + 12400 + 45% of 24000 = 130200
Q4. If number of students having (10th + ITI) qualification from MP is 25% more than that from Assam having same qualification then total number of students having (10th + ITI) from these two states is what percent of total number of students having (10th + ITI) from all the six states together? It is given that total number of students from Assam having (10th + ITI) qualification is 10,000
    A. 28[latex] \frac{22} {101}[/latex]% B. 22[latex] \frac{28} {101}[/latex]% C. 26[latex] \frac{28} {101}[/latex]% D. 22[latex] \frac{38} {101}[/latex]% E. 28[latex] \frac{38} {101}[/latex]%

Answer: Option B
Solution:
No. of students from MP and Assam together having (10th + ITI) qualification
10000 + [latex] \frac{5} {4}[/latex] x 10000 = 22,500
Total students from all the six states together having (10th + ITI) qualification
= 16,400 + 42,000 + 12,500 + 10,500 + 9,600 + 10,000 = 1,01,000
∴ Required percentage
= [latex] \frac{22,500} {1,01,000}[/latex] x 100
= 22[latex] \frac{28} {101}[/latex]
Q5. If total number of students having 12th qualification from UP is 100% more than that from Gujrat and Jharkhand together having same qualification, then what is the total number of students having 12th qualification from U.P. It is given that the ratio of number of students from Gujrat and Jharkhand having 12th qualification is 8 : 7 and total number of students having 12th qualification from all the states is 85,700.
    A. 36,000 B. 45,000 C. 24,000 D. 54,000 E. 32,000

Answer: Option A
Solution:
Let no. of students from Gujrat and Jharkand having 12th qualification is 8x and 7x respectively.
8x + 7x + [latex] \frac{200} {100}[/latex] × (8x + 7x) + 12,500 + 10,000 + 9,200 = 85,700
⇒ x = 1,200
∴ Required answer = 1200 × 30 = 36,000
Directions (1-5): Study the following table carefully to answer the questions that follow. The table shows the income and expenditure in lakhs of A and B in five different years. Note- profit = Income - expenditure.
Profit% = [latex] \frac{profit} {expenditure}[/latex]

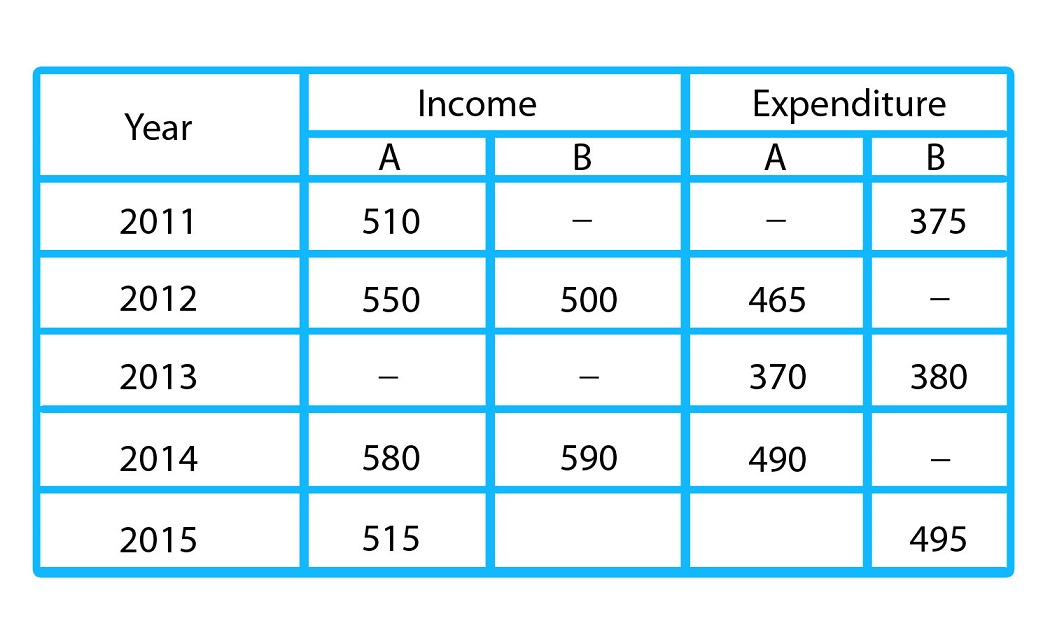
Q1. If the percentage profit of A in year 2011 is 20% then his expenditure is by how much percent (approximately) more or less than that of A in year 2014?
    A. 11% more B. 18% less C. 8% less D. 13% less E. 22% more

Answer: Option D
Solution:
Expenditure of A in 2011 = [latex] \frac{510} {1.2}[/latex]= 425 lakh
∴ Required percentage = [latex] \frac{490 - 425} {420}[/latex] x 100 ≈ 13% less
Q2. In year 2014, A expended 10 lakh more than B. Find what is the approximate percentage profit of B in the same year?
    A. 23% B. 25% C. 35% D. 20% E. 27 %

Answer: Option A
Solution:
Required percentage profit = [latex] \frac{590 - 480} {480}[/latex] x 100 ≈ 23%
Q3. What was the average income amount (in lakh) of A and B together in year 2013 if percentage profit earned by A was 16% and that of B was 17%?
    A. 76[latex] \frac{7} {7}[/latex]% B. 68[latex] \frac{4} {7}[/latex]% C. 87[latex] \frac{4} {7}[/latex]% D. 78[latex] \frac{4} {7}[/latex]% E. 74[latex] \frac{4} {7}[/latex]%

Answer: Option A
Solution:
Income of A in 2013 = [latex] \frac{16 x 730} {100}[/latex] + 370 = 429.2 lakh
Income of B in 2013 = [latex] \frac{17 x 380} {100}[/latex] + 380 = 446.2 lakh
∴ Average income = [latex] \frac{873.8} {2}[/latex] = Rs. 436.9 lakh
Q4. If cost price of one Quant book, one Reasoning book and one English book is Rs. 150, Rs. 120 and Rs. 100 respectively then total selling price of these three books in Rajasthan is what percent more or less than the total selling price of these three books in Haryana (Nearest integer)?
    A. 6% more B. 6% less C. 8% less D. 8% more E. 4% less

Answer: Option D
Solution:
Required percentage = [latex] \frac{515 - 30} {550}[/latex] x 100 ≈ 86%
Q5. What is the average number of Reasoning books sold in five states together?
    A. 20,000 B. 25,000 C. 18,000 D. 20,500 E. 22,000

Answer: Option B
Solution:
Required percentage = [latex] \frac{550 - 90} {90}[/latex] x 100 ≈ 511%
Directions (1-5): The following bar graph shows the number of three types of books viz. Quantitative Aptitude, Reasoning Ability and English sold by Adda247 Publication in five different states of India, in the year 2017. The table shows the profit percentage earned by Adda247 Publication from these five states on the three books given above. Study both the graphs carefully and answer the questions that follow:


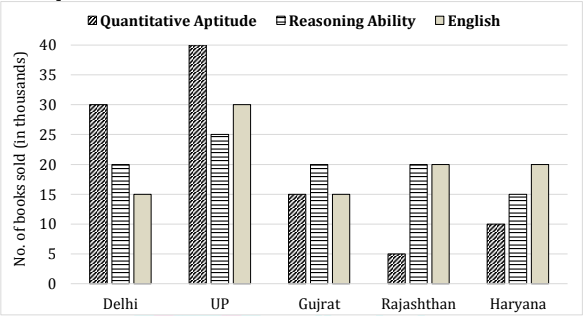
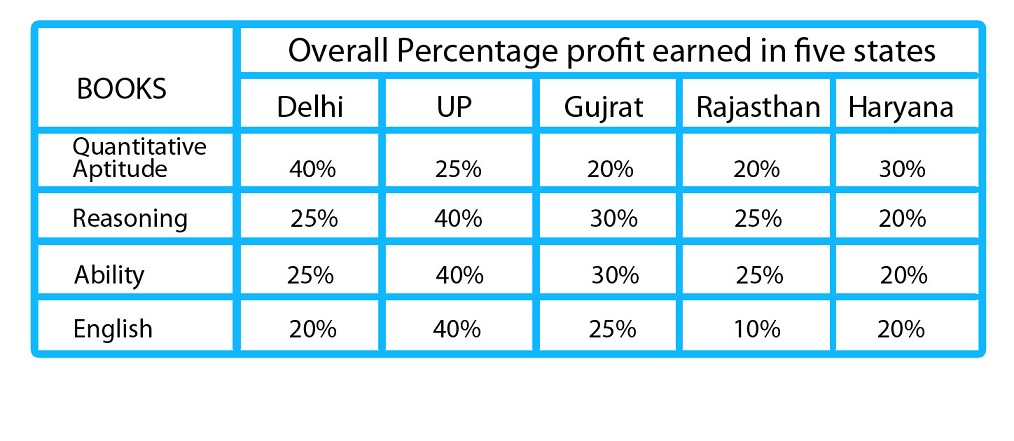
Q1. If cost price of one book of Quantitative Aptitude is Rs. 150 then what is the total selling price of this book earned from Delhi, Gujrat and Rajasthan together (in Rs. lakhs)?
    A. 89 B. 101 C. 99 D. 94 E. 109

Answer: Option C
Solution:
Selling price earned from Delhi = 30,000 × 150 × [latex] \frac{140} {100}[/latex]
= 63,00,000
Selling price earned from Gujrat
= 15,000 × 150 ×[latex] \frac{120} {100}[/latex]
= 27,00,000
Selling price earned from Rajasthan
= 5,000 × 150 × [latex] \frac{120} {100}[/latex]
= 9,00,000
∴ Total selling price earned = 63,00,000 + 27,00,000 + 9,00,000 = 99,00,000
Q2. What is the total profit earned on Reasoning book from UP, Gujrat and Haryana if cost price of one Reasoning book is Rs. 120 (in Rs. lakhs)
    A. 2.28 B. 22.8 C. 24.8 D. 22.4 E. 18.8

Answer: Option B
Solution:
Total profit earned
= 25,000 × 120 × [latex] \frac{40} {100}[/latex] + 20,000 × 120 × [latex] \frac{30} {100}[/latex] + 15,000 × 120 × [latex] \frac{20} {100}[/latex]
= Rs. 22,80,000
Required percentage profit = [latex] \frac{590 - 480} {480}[/latex] x 100 ≈ 23%
Q3. Total no. of Quantitative Aptitude books sold in UP, Rajasthan and Haryana is what percentage of total English books sold in these states?
    A. 436.9 B. 438.2 C. 408.8 D. 440.9 E. 456.9

Answer: Option D
Solution:
Total Quantitative Aptitude books sold in UP, Rajasthan and Haryana together
= 40,000 + 5,000 + 10,000 = 55,000
Total English books sold in these states together
= 30,000 + 20,000 + 20,000 = 70,000
∴ Required percentage = [latex] \frac{55,000} {70,000}[/latex] × 100 = 78 [latex] \frac{4} {7}[/latex]%
Q4. If in year 2015 A earns a profit of 30 lakh, then his expenditure is approximately what percent of income of A in year 2012?
    A. 82 B. 78 C. 80 D. 86 E. 92

Answer: Option B
Solution:
Total selling price of all the three books in Rajasthan
= 5,000 × 150 × [latex] \frac{120} {100}[/latex] + 20,000 × 120 × [latex] \frac{125} {100}[/latex] + 20,000 × 100 × [latex] \frac{110} {100}[/latex] = 61,00,000
Total selling price of all the three books in Haryana
= 10,000 × 150 × [latex] \frac{130} {100}[/latex] + 15,000 × 120 × [latex] \frac{120} {100}[/latex] + 20,000 × 100 × [latex] \frac{120} {100}[/latex] = 65,10,000
∴ Required percentage
= [latex] \frac{65,10,000 − 61,00,000} {65,10,000}[/latex] × 100
≃ 6% less
Q5. Income of A in year 2012 is by how much percent more than profit of A in 2014? (approximately)
    A. 520% B. 511% C. 490% D. 481% E. 610%

Answer: Option A
Solution:
Required average no. of Reasoning books
= [latex] \frac{1} {5}[/latex] × (20 + 25 + 20 + 20 + 15) × 1000 = 20,000
Directions (1-5): Study the following graph carefully to answer the questions that follow:

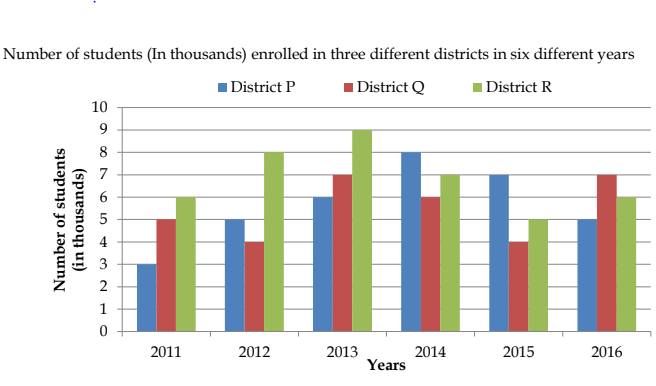
Q1. What was percentage increase in enrollment in the number of students in District-R in year 2013 as compared to that of the previous year?
    A. 115.5% B. 112.5% C. 15.5% D. 12.5% E. 16.5%

Answer: Option D
Solution:
Required percentage increase
= [latex] \frac{9 - 8} {8}[/latex] × 100 = [latex] \frac{100} {8}[/latex]
= 12.5%
Q2. What was the difference between the number of students enrolled in all the three districts in the year 2014 together and the number of students enrolled in District-Q over all the years together?
    A. 12,000 B. 11,000 C. 1,100 D. 1,400 E. 16,000

Answer: Option A
Solution:
Number of students enrolled in all the three district in the year 2014
= (8 + 6 + 7) = 21 thousands
Number of students enrolled in District-Q over all the years together
= (5 + 4 + 7 + 6 + 4 + 7) = 33 thousands
∴ Required difference = (33 – 21) = 12,000
Q3. What was the approximate average number of students enrolled in District-P over all the years together?
    A. 5,999 B. 5,666 C. 5,444 D. 53,333 E. 43,333

Answer: Option B
Solution:
Average number of students enrolled in District-P over all the years together
= [latex] \frac{1} {6}[/latex] × (3 + 5 + 6 + 8 + 7 + 5) = [latex] \frac{1} {6}[/latex] × 34
≃ 5.666 thousands
≃ 5666 (approximately)
Q4. In which year was the number of students enrolled in all the three districts together second highest?
    A. 2011 B. 2012 C. 2014 D. 2013 E. 2016

Answer: Option C
Solution:
The highest number of students may be in year 2013 or 2014 from the graph.
∴ Students enrolled in 2013
= (6 + 7 + 9) = 22 thousands and students enrolled in 2014 = (8 + 6 + 7) = 21 thousands
∴ second highest enrolled students are in 2014
Q5. Total number of students enrolled in the District-P and District –Q together in the year 2016 was what percentage of the total number of students enrolled in District-P in the year 2014?
    A. 150 B. 120 C. 250 D. 220 E. 240

Answer: Option A
Solution:
Total number of students enrolled in the year 2016 from district-P and Q = (5 + 7) = 12 thousands
Number of students enrolled in District-P in 2014 = 8 thousands
Required percentage = [latex] \frac{12} {8}[/latex] x 100
[latex] \frac{3} {2}[/latex] x 100
150%
Directions (1-5): Study the following graph carefully and answer the questions given below:

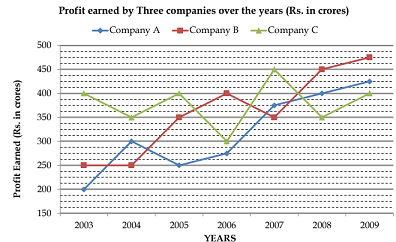
Q1. What was the average profit earned by all the three companies in the year 2008?
    A. Rs. 300 crore B. Rs. 400 crore C. Rs. 350 crore D. Rs. 520 crore E. None of these

Answer: Option B
Solution:
Average profit earned by three companies in the year 2008
[latex] \frac{1} {3}[/latex] x (350 + 400) + 450 = [latex] \frac{1} {3}[/latex] x 1200
Q2. In which of the following years was the difference between the profits earned by company B and company A the minimum?
    A. 2003 B. 2004 C. 2005 D. 2008 E. 2007

Answer: Option E
Solution:
From line graph, it is clear that in the year 2007, the difference is minimum.
Q3. In which of the following years was the total profit earned by all three companies together the highest?
    A. 2004 B. 2007 C. 2008 D. 2009 E. 2005

Answer: Option D
Solution:
From graph, the highest total profit is earned in 2009 and it is
= 400 + 425 + 475 = 1300
Q4. What was the percentage increase in the profit earned by Company A from 2006 to 2007?
    A. 36[latex] \frac{4} {11}[/latex]% B. 24[latex] \frac{4} {11}[/latex]% C. 40[latex] \frac{4} {11}[/latex]% D. 20[latex] \frac{7} {11}[/latex]% E. 54[latex] \frac{6} {11}[/latex]%

Answer: Option A
Solution:
% increase in profit earned by A from 2006 to 2007
= [latex] \frac{375 - 275} {275}[/latex] x 100
= [latex] \frac{100} {275}[/latex] x 100
= [latex] \frac{400} {11}[/latex]
= 36[latex] \frac{4} {11}[/latex]%
Q5. What was the difference between the profit earned by company A in 2004 and the profit earned by company C in 2009?
    A. Rs. 50 crores B. Rs. 1 crores C. Rs. 100 crores D. Rs. 200 crores E. None of these

Answer: Option C
Solution:
Required difference = (Profit earned by A in 2004) ~ (Profit earned by C in 2009) = 400 – 300 = 100 crores
Directions (1-5): The following table shows the no. of students who applied for various posts in DMRC recruitment from five different states in a certain year.
Study the table carefully to answer the following questions.

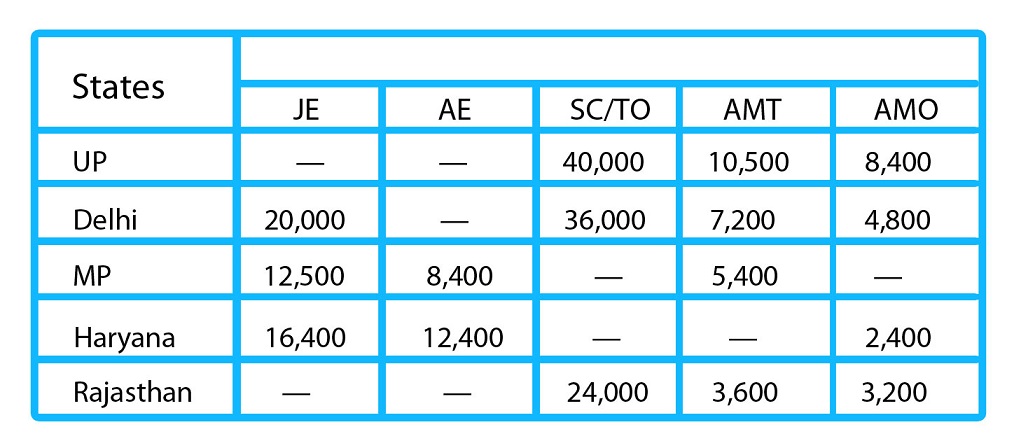
Q1. If ratio of total no. of students from UP who applied for JE and AE respectively is 81 : 61 and total no. of candidates from U.P is 1,15,700 then total no. of candidates from UP who applied for the post of AE is
    A. 28,400 B. 22,400 C. 24,400 D. 24,000 E. 20,800

Answer: Option C
Solution:
Let total no. of students who applied for the post of JE and AE from UP are 81x and 61x respectively.
∴ 81x + 61x = 1,15,700 – (40,000 + 10,500 + 8,400)
= 56,800 ⇒ x = 400
∴ Required answer = 61 × 400
= 24,400
Q2. If the average no. of candidate from Delhi who applied for the various posts is 16,880 then total no. of candidate who applied for the post of AE from Delhi is what percent of no. of candidates from same state who applied for AMT?
    A. 279[latex] \frac{7} {9}[/latex]% B. 227[latex] \frac{7} {9}[/latex]% C. 223[latex] \frac{7} {9}[/latex]% D. 229[latex] \frac{7} {9}[/latex]% E. None of these

Answer: Option B
Solution:
Total candidates from Delhi who applied for the post of AE = 5 × 16,880 – (20,000 + 36,000 + 7,200 + 4,800)= 16,400
Required percentage = [latex] \frac{16,400} {7,200}[/latex] × 100 = 227 [latex] \frac{7} {9}[/latex]%
Q3. If 60% students out of total students from Haryana who applied for the post of JE are having Electrical Engineering as their essential qualification then total no. of candidates from Rajasthan who applied for JE is: (It is given that total students from Rajasthan who applied for JE is 150% of the no. of Electrical Engineering students who applied for the post of JE from Haryana)
    A. 12,760 B. 14,670 C. 16,470 D. 14,760 E. 18,460

Answer: Option D
Solution:
Required answer = [latex] \frac{150} {100}[/latex] × [latex] \frac{60} {100}[/latex] × 16,400
= 14,760
Q4. Total no. of students from MP who applied for the post of SC/TO is 80% of the total no. of students who applied for JE from Delhi. Find total no. of students from MP who applied for the post JE, AE, SC/TO and AMT together.
    A. 42,300 B. 43,200 C. 45,300 D. 44,300 E. 41,200

Answer: Option A
Solution:
Required total no. of candidates = 12,500 + 8,400 + [latex] \frac{80} {100}[/latex] × 20,000 + 5,400
= 42,300
Q5. If [latex] \frac{225} {14}[/latex]% students out of total students from all the states together who applied for the post of AMO, are from MP then find the no. of students from MP who applied for the post of AMO.
    A. 4800 B. 3200 C. 3600 D. 2800 E. 5400

Answer: Option C
Solution:
(100 − [latex] \frac{225} {14}[/latex]% = [latex] \frac{1175} {1400}[/latex] = [latex] \frac{47} {56}[/latex]%
∴[latex] \frac{47} {56}[/latex] → (8400 + 4800 + 2400 + 3200)
⇒ Total no. of candidates from all states together
=[latex] \frac{56} {47}[/latex] × 18,800 = 22,400
∴ Required answer = 225
[latex] \frac{22,000} {1400}[/latex] × 22,400 = 3,600
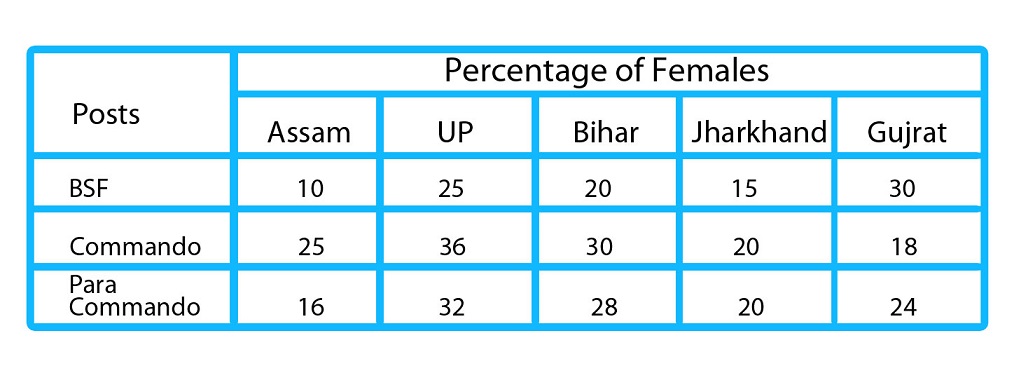
Directions (1-5):The following line graph shows the no. of persons who were found physically fit in army training for three different posts from five different states of India. The table shows percentage of female in them. Study both the graphs carefully to answer the questions that follow:


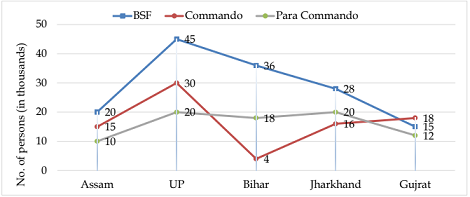
Q1. Find the total no. of males who were physically fit for BSF from all the five states together. (in thousands)
    A. 14.85 B. 114.85 C. 115.45 D. 112.85 E. 116.85

Answer: Option B
Solution:
Required total no. of males
[latex] \frac{90} {100}[/latex] x 20 + [latex] \frac{85} {100}[/latex] x 36 + [latex] \frac{85} {100}[/latex] x 28 + [latex] \frac{70} {100}[/latex] x 15
= 114.85 thousand
Q2. The total no. of females for commando post from UP is what percent more than the no. of females for the same post from Gujrat?
    A. 160[latex] \frac{2} {3}[/latex]% B. 50% C. 233[latex] \frac{1} {3}[/latex]% D. 550% E. 350%

Answer: Option C
Solution:
Required percentage = [latex] \frac{30 × 36 − 18 × 18} {18 × 18}[/latex] x 100 = 233 [latex] \frac{1} {3}[/latex]%
Q3. What is the difference between total no. of males from Bihar and total no. of males from Gujrat for all the three posts who were physically fit.
    A. 7660 B. 8600 C. 8040 D. 8160 E. 8406

Answer: Option A
Solution:
No. of males from Bihar
([latex] \frac{80} {100}[/latex] x 36 + [latex] \frac{70} {100}[/latex] x 4 + [latex] \frac{72} {100}[/latex] x 18)
= 42.04 thousand
No. of males from Gujrat
= ([latex] \frac{70} {100}[/latex] x 15 + [latex] \frac{82} {100}[/latex] x 18 + [latex] \frac{76} {100}[/latex] x 12)
34.38 thousand
∴ Required difference = 42.04 – 34.38 = 7.66 thousands
Q4. Total no. of females from UP and Assam together for the post of commando is approximately what percent of total no. of females from Bihar and Jharkhand for the same post who were physically fit?
    A. 195% B. 145% C. 270% D. 330% E. 167%

Answer: Option D
Solution:
Total no. of females from UP and Assam together for the post commando
= [latex] \frac{36} {100}[/latex] x 30 + [latex] \frac{25} {100}[/latex] x 16
4.4 thousand
∴ Required percentage = [latex] \frac{14.55} {4.4}[/latex] × 100≃ 330%
Q5. What is the difference between total no. of persons from all the five states together for the post commando and total no. of persons for the post para commando from all the five states together?
    A. 4000 B. 3000 C. 5000 D. 7000 E. 1000

Answer: Option B
Solution:
Required difference
= (15 + 30 + 4 + 16 + 18) – (10 + 20 + 18 + 20 + 12)
= 3 thousand
Directions (1-5): The following pie-chart shows the distribution of the number of vacancies in different banks to be filled through IBPS PO recruitment exam in 2010 and 2015.


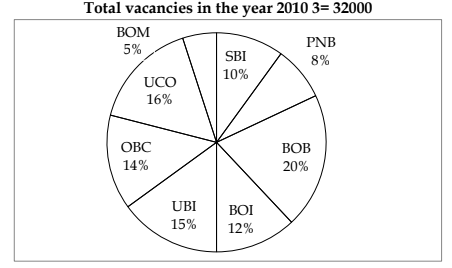
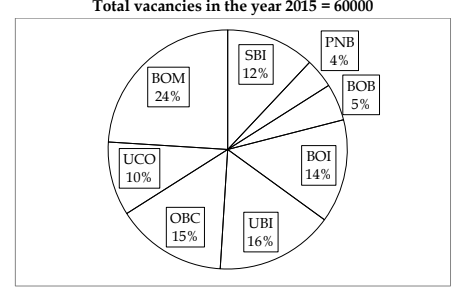
Q1. What is the difference between the central angle made by vacancies in banks SBI, UBI and UCO in the year 2010 and that of by vacancies in banks PNB, OBC and BOM in the year 2015?
    A. 9.6° B. 8.2° C. 4.6° D. 7.2° E. 5.4°

Answer: Option D
Solution:
Required difference
[latex] \frac{43} {100}[/latex] x 360 - [latex] \frac{41} {100}[/latex] x 360 = 7.2°
Q2. What is the percentage increase in number of vacancies in SBI and PNB together from 2010 to year 2015?
    A. 65[latex] \frac{2} {3}[/latex]% B. 60% C. 62[latex] \frac{2} {3}[/latex]% D. 66[latex] \frac{2} {3}[/latex]% E. None of these

Answer: Option D
Solution:
Vacancies in SBI and PNB together in 2010 = [latex] \frac{18} {100}[/latex] x 32000 = 5760
Vacancies in SBI and PNB together in 2015 = [latex] \frac{16} {100}[/latex] x 60000 = 96000
∴ Required % = [latex] \frac{9600 - 5760} {5760}[/latex]
= 66[latex] \frac{2} {3}[/latex]%
Q3. What is the ratio of the number of vacancies in UCO, UBI and BOB in the year 2015 to the number of vacancies in PNB, BOI and BOM in the year 2010?
    A. 93:40 B. 85:84 C. 19:18 D. 61:59 E. 111: 91

Answer: Option A
Solution:
Required Ratio = [latex] \frac{(10 + 16 + 5) × 60} {(8 + 12 + 5) × 32}[/latex]
= [latex] \frac{31 × 60} {25 × 32}[/latex]
= 93 ∶ 40
Q4. The number of vacancies in SBI, PNB and BOI in the year 2015 is approximately what percent of the number of vacancies in BOB, UCO and BOM in the year 2010?
    A. 122.5% B. 130.25% C. 137.2% D. 150% E. 167.25%

Answer: Option C
Solution:
Required %
= [latex] \frac{12 + 4 + 14/100 x 6000} {20 + 16 + 5 x 100}[/latex] × 32000
= 30 × 60
= 41 × 32 × 100 = 137.2%
Q5. The number of vacancies in UCO and BOB together in the year 2010 is what percent more than the number of vacancies in same banks together in 2015?
    A. 12% B. 17% C. 24% D. 28% E. 35%

Answer: Option D
Solution:
Vacancies in UCO and BOB together in 2010 = [latex] \frac{16 + 20} {100}[/latex] x 32000
Vacancies in UCO and BOB together in 2015 = [latex] \frac{15} {100}[/latex] x 60000
∴ Required % = [latex] \frac{11520 - 9000} {9000}[/latex] x 100
= 28%
Directions (1-5): Study the following graph carefully and answer the questions given below it.

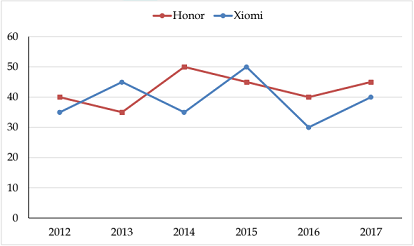
Percentage of profit earned by two companies Xiomi and Honor over the given years
% Profit = [latex] \frac{Income − Expenditure} {Expenditure}[/latex] x 100
Q1. Total expenditure of Company Xiomi in all the years together was 82.5 lakhs. What was the total income of the Company in all the years together?
    A. 38 lac B. 40 lac C. 45 lac D. Cannot determined E. None of these

Answer: Option D
Solution:
Income of Honor = I1 in 2013
∴ 35 = [latex] \frac{I1 − 12} {12}[/latex] x 100
I1 = Rs. 16.2 L
In 2014, Let Income = I2
∴ 50 = [latex] \frac{I2 − 14.5} {14.5}[/latex] x 100
I2 = 21.75 L
∴ total income = 21.75 L + 16.2 L = 37.95 L
Q2. Ratio of expenditure of companies Xiomi and Honor in 2016 was 3 : 4 respectively. What was the respective ratio of their incomes in 2016?
    A. 2 : 3 B. 23 : 37 C. 43 : 56 D. 29 : 46 E. 39 : 56

Answer: Option E
Solution:
Let the respective expenditures of both Xiomi and Honor be Rs. 3x and Rs. 4x lakhs.
∴ Ixiomiin 2016 ⇒ 30 = [latex] \frac{I1 − 3x} {3x}[/latex] × 100
or, I1 = 3.9x
Again, IHonor in 2016 ⇒ 40 =
[latex] \frac{I2 − 4x} {4x}[/latex] × 100
⇒ I2 = 5.6x
Desired ratio ⇒ Ixiomi ∶ IHonor = 3.9x ∶ 5.6x
= 39 : 56
Q3. Total expenditure of Company Xiomi in all the years together was 82.5 lakhs. What was the total income of the Company in all the years together?
    A. 38 lac B. 40 lac C. 45 lac D. Cannot determined E. None of these

Answer: Option D
Solution:
It can’t be determined as data given are inadequate.
Q4. If the expenditures of Companies Xiomi and Honor in 2017 were equal and the total income of the two companies was Rs. 5.7 lakh, What was the total expenditure of the two companies in 2017?
    A. 4 lac B. 5 lac C. 6 lac D. 8 lac E. 10 lac

Answer: Option A
Solution:
Let expenditure of both Xiomi and Honor in 2017 be Rs. x lakhs & their respective incomes be Rs. I1 & I2 lakhs.
∴ Profit% for Xiomi = 40 & Profit% for Honor = 45
∴ 40 = [latex] \frac{I1 − x} {x}[/latex] × 100 ... (i)
& 45 = [latex] \frac{I2 − x} {x}[/latex] × 100 ... (ii)
From (i) and (ii)
x = Rs. 2L
∴ Total expenditure = 2 × 2 = Rs. 4 lakh
Q5. If the income of Company Honor in 2014 and 2015 were in the ratio of 2 : 3 respectively. What was the respective ratio of expenditure of that Company in these two years?
    A. 2 : 3 B. 4 : 5 C. 29 : 45 D. 39 : 55 E. None of these

Answer: Option C
Solution:
Let the income be Rs. 2x and Rs. 3x lakhs respectively in 2014 and 2015 for Honor.
∴ In 2014,
50 = [latex] \frac{2x − E1} {E1}[/latex] × 100
⇒ 1.5 E1 = 2x
⇒ E1 = [latex] \frac{2x} {1.5}[/latex] Lakh
In 2015,
45 = [latex] \frac{3x − E2} {E2}[/latex] × 100
⇒ E2 = [latex] \frac{3x} {1.45}[/latex]
∴ [latex] \frac{2x} {1.5}[/latex] : [latex] \frac{3x} {1.45}[/latex] = 29 ∶ 45.
Directions (1-5): The following pie-chart shows the percentage distribution of medals won by six countries in 21st CWG 2018 which is held in Australia.

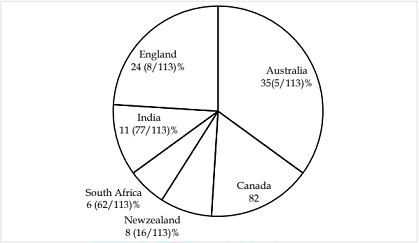
Study the pie-chart carefully to answer the following questions.
Some data are in percentage value and some are in total absolute value. Total medals include gold, silver and bronze and each country has won all the three medals.
Q1. If ratio of gold medals, silver medals and bronze medals won by India is 13 : 10 : 10 then find the number of gold medals won by India.
    A. 30 B. 32 C. 26 D. 40 E. 45

Answer: Option C
Solution:
No. of gold medals won by India
[latex] \frac{13} {33}[/latex] x [latex] \frac{1320} {11300}[/latex] x 565 = 26
Q2. If number of gold medals won by Canada is 65[latex] \frac{1} {2}[/latex]% less than number of silver medals won by the same country then what is the total number of silver medals won by Canada?
    A. 45 B. 27 C. 40 D. can’t be determined E. 62

Answer: Option D
Solution:
Answer cannot be determined because there is no information about bronze medals.
Q3. Find the average number of medals won by Australia, England and India together.
    A. [latex] \frac{400} {3}[/latex] B. [latex] \frac{200} {3}[/latex] C. [latex] \frac{500} {3}[/latex] D. [latex] \frac{400} {9}[/latex] E. [latex] \frac{100} {3}[/latex]

Answer: Option A
Solution:
Average no. of medals who by Australia, England & India together =
= [latex] \frac{1} {3}[/latex] ([latex] \frac{3960} {11360}[/latex]) + ([latex] \frac{2720} {11360}[/latex]) + ([latex] \frac{1320} {11360}[/latex]) x 565 = ([latex] \frac{400} {3}[/latex])
Q4. If number of gold medals who by South Africa is [latex] \frac{1300} {11}[/latex]% of number of silver medals won by it and number of bronze medals won by South Africa is equal to the number of gold medals won by it then what is the number of gold medals won by South Africa?
    A. 15 B. 11 C. 13 D. 17 E. 19

Answer: Option C
Solution:
Let no. of silver medals won by South Africa = x
∴ x + 2 × [latex] \frac{1300} {1100}[/latex]
x = [latex] \frac{740} {11300}[/latex] × 565
⇒[latex] \frac{37x} {11}[/latex]
= 37 ⇒ x = 11
∴ No. of gold medals won by South Africa
= [latex] \frac{1300} {1100}[/latex] × 11 = 13
Q5. If number of gold medals won by Australia is 77[latex] \frac{7} {9}[/latex]% more than the number of gold medals won by England and number of gold medals won by England is 33[latex] \frac{3} {34}[/latex]% of total medals won by it then what is the total number of gold medals won by Australia?
    A. 70 B. 95 C. 80 D. 100 E. 90

Answer: Option C
Solution:
No. of gold medals won by England
= [latex] \frac{1125} {3400}[/latex] x [latex] \frac{2720} {11300}[/latex] x 565
= 45
∴ No. of gold medals won by Australia = [latex] \frac{1600} {900}[/latex] x 45 = 80
Directions (1-5): The following Bar-graph shows the number of Banking and SSC test booklets sold by Bankersadda in five different Cities of India.
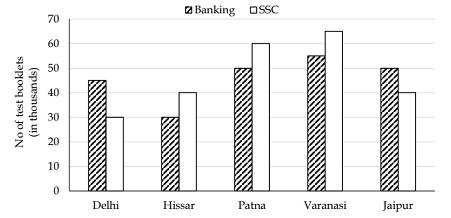
The table shows the percentage of sellings of these booklets in there five different cites by online and offline mode.

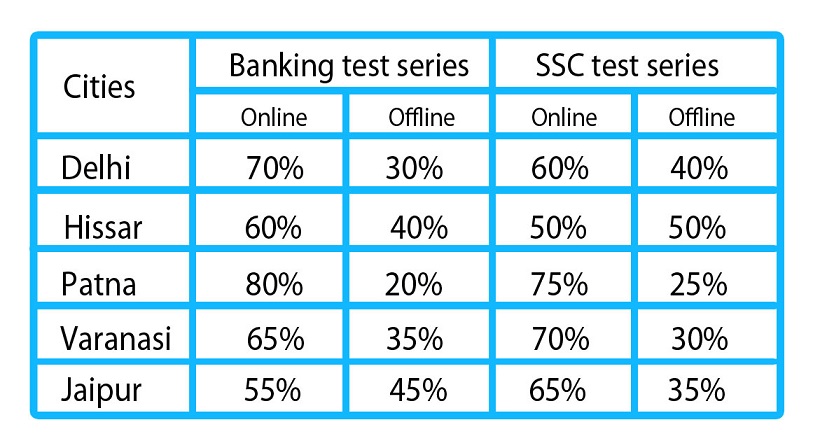
No booklet remains unsold in any city.
Q1. Total no. of banking test booklets sold online in cities Delhi and Patna together is what percent more or less than the total no. of SSC booklets sold online in these cities together?
    A. 13[latex] \frac{31} {63}[/latex]% more B. 13[latex] \frac{31} {63}[/latex]% less C. 15[latex] \frac{31} {63}[/latex]% more D. 15[latex] \frac{31} {63}[/latex]% less E. None of these

Answer: Option A
Solution:
Total Banking booklets sold online in Delhi and Patna together
= [latex] \frac{70} {100}[/latex] x 45 + [latex] \frac{80} {100}[/latex] x 50
= 71.5 thousand
Total SSC booklets sold online in Delhi and Patna together
[latex] \frac{60} {100}[/latex] x 30 + [latex] \frac{75} {100}[/latex] x 60
= 63 thousand
∴ Required percentage = [latex] \frac{71.5 - 63} {63}[/latex] x 100
= 13[latex] \frac{31} {63}[/latex]%
Q2. If 25% and 40% profits are earned on total SSC booklets sold online and Banking booklets sold online respectively in Hissar then find the total selling price obtained from online selling of the two types of books from city Hissar. It is given that cost price of one banking test booklet is Rs. 150 and cost price of one SSC Booklet is Rs. 120? (in lakh rupee)
    A. 78 B. 73 C. 67.5 D. 57.5 E. 63.5

Answer: Option C
Solution:
Total selling price obtained
= 30×150×[latex] \frac{140} {100}[/latex] + 40 x 120 x [latex] \frac{125} {100}[/latex]
= 6300 + 6000
= 123 lacs
Q3. The average of online selling of Banking booklets in city Delhi, Patna and Jaipur together is what percent of average of online selling of SSC booklets in there cities together?
    A. 121[latex] \frac{11} {89}[/latex]% B. 111[latex] \frac{21} {89}[/latex]% C. 121[latex] \frac{11} {89}[/latex]% D. 141% E. 131[latex] \frac{21} {89}[/latex]%

Answer: Option B
Solution:
Average of online selling of Banking booklets in Delhi, Patna and Jaipur together
= [latex] \frac{1} {3}[/latex] x ([latex] \frac{70} {100}[/latex] x 45 + [latex] \frac{80} {100}[/latex] x 50 + [latex] \frac{55} {100}[/latex] x 50)
= 33 thousand
Average of online selling of SSC booklets in Delhi, Patna & Jaipur together
[latex] \frac{1} {3}[/latex]x ([latex] \frac{60} {100}[/latex] x 30 + [latex] \frac{75} {100}[/latex] x 60 + [latex] \frac{65} {100}[/latex] x 40)
= [latex] \frac{89} {3}[/latex] thousand
∴ Required percentage = [latex] \frac{33 x 3} {89}[/latex] x 100 = 111[latex] \frac{21} {89}[/latex]%
Q4. What is difference between total no. of Banking booklets sold offline in all of the five cities and total no. of SSC booklets sold offline in all the five cities together (in thousand)
    A. 8.5 B. 7.75 C. 4.25 D. 3.25 E. 3.75

Answer: Option D
Solution:
Total no. of banking booklets sold offline in all the five cities
[latex] \frac{30} {100}[/latex] x 45 + [latex] \frac{40} {100}[/latex] x 30 + [latex] \frac{20} {100}[/latex] x 50 + [latex] \frac{35} {100}[/latex] x 55 + 45 x [latex] \frac{50} {100}[/latex]
= 77.25 thousand
Total no. of SSC booklets sold offline in all the five cities
[latex] \frac{4} {100}[/latex] x 30 + [latex] \frac{50} {100}[/latex] x 40 + [latex] \frac{25} {100}[/latex] x 60 + [latex] \frac{30} {100}[/latex] x 65 + [latex] \frac{35} {100}[/latex] x 40
= 80.5 thousand
∴ Required difference = 80.5 – 77.25 = 3.25 thousand
Q5. Total Banking booklets sold in Hissar and Varanasi together is what percent more or less than the total no. of SSC booklets sold in Patna and Jaipur together?
    A. 15% more B. 15% less C. 25% less D. 25% more E. 20% more

Answer: Option B
Solution:
Total no. of banking booklets sold in Hissar and Varanasi together = 30 + 55 = 85 thousand
Total no. of SSC booklets sold in Patna and Jaipur together
= 60 + 40 = 100 thousand
Required percentage = [latex] \frac{100 - 85} {100}[/latex] x 100
= 15% less
Directions (1-5): The following line graph shows the production of pencils of two companies HB and Class mate during five different years. Study the graph carefully and answer the related questions.

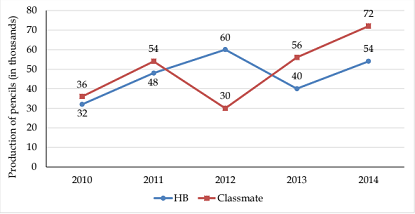
Q1. What is the average no. of HB pencils produced throughout all the years?
    A. 48,900 B. 44,800 C. 46,800 D. 46,200 E. 44,650

Answer: Option C
Solution:
Required average = [latex] \frac{1} {5}[/latex] x (32 + 48 + 60 + 40 + 54) × 1000
= 46,800
Q2. If cost price of one class mate pencil in 2011 is Rs. 8 and class mate company made 75% profit as a whole in the same year then find the selling price of one class mate pencil.
    A. Rs. 16 B. Rs. 14 C. Rs. 12 D. Rs. 10 E. Rs. 18

Answer: Option B
Solution:
S.P. of one class mate pencil
S.P. = [latex] \frac{54000 X 8 X 175} {54000 X 100}[/latex]
= Rs. 14
Q3. The production of HB pencils in the years 2010, 2012 and 2014 together is approximately what percent of total classmate pencils produced in the years 2011, 2013 and 2014 together?
    A. 92% B. 72% C. 86% D. 80% E. Can’t be determined

Answer: Option D
Solution:
The production of HB pencils in the years 2010, 2012 and 2014 together
= (32 + 60 + 54) thousand
= 146 thousand
Production of class mate pencils in the years 2011, 2013 and 2014 together
= (54 + 56 + 72) thousand
= 182 thousand
∴ Required percentage = [latex] \frac{146} {182}[/latex]
Q4. If 10% class mate pencils out of total class mate pencils produced during all the years together found to be defective and company made a net profit of 20% on each pencil of the remaining non- defective pencils by selling at the rate of Rs.12 per piece then find overall profit/loss to the classmate company. (Production cost of pencil in every year is same)
    A. Rs. 1,98,400 B. Rs. 1,94,400 C. Rs. 1,89,400 D. Rs. 1,96,400 E. Rs. 1,94,800

Answer: Option A
Solution:
Total non-defective pencils = 12[latex] \frac{90} {100}[/latex] x 248000
= 2,23,200
∴ Production Cost of one pencil = 12 [latex] \frac{100} {120}[/latex] x 248000 = Rs. 10
∴ Total selling price = 2,23,200 × 12
= 26,78,400
Total production cost price = 2,48,000 × 10
= 24,80,000
∴ Overall profit/loss = 26,78,400 – 24,80,000
= Rs. 1,98,400
Q5. What is the difference between total pencils produced by the two companies throughout all the years together?
    A. 16,000 B. 14,000 C. 12,500 D. 14,400 E. 16,600

Answer: Option B
Solution:
Required difference
= (36 + 54 + 30 + 56 + 72) − (32 + 48 + 60 + 40 + 54)
= (248 − 234) thousand
= 14,000
Directions (1-5): The following pie-chart shows the no. of persons (in degree) who were awarded for their bravery and intelligence during critical conditions in the year 2017 in various states.
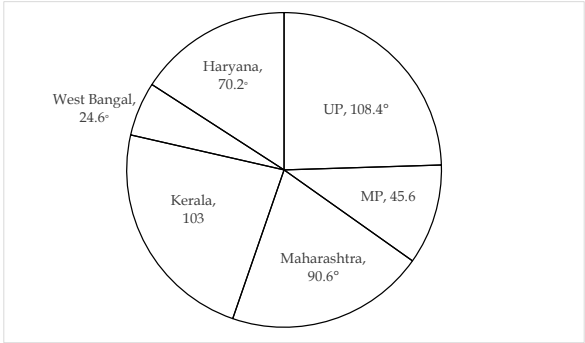
Study the graph carefully to answer the following question.
Q1. Find the total no. of person who were awarded for their bravery and intelligence in the state UP, Maharashtra and West Bengal together.
    A. 1218 B. 1118 C. 1018 D. 1128 E. 1108

Answer: Option B
Solution:
Required answer = 542 + 453 + 123 = 1118
Q2. Total persons who were awarded for their bravery and intelligence in states Haryana and Kerala together are what percent more or less than that in state Maharashtra?
    A. [latex] \frac{100} {541}[/latex]% more B. [latex] \frac{50} {227}[/latex]% more C. [latex] \frac{100} {453}[/latex]% more D. Can’t be determined E. None of these

Answer: Option C
Solution:
Required parentage = [latex] \frac{454 - 453} {453}[/latex] x 100
= [latex] \frac{100} {453}[/latex]% more
Q3. If ratio of male to female who were awarded for their bravery and intelligence in states MP and west Bengal be 2 : 1 and 1 : 2 respectively then total females of MP are approximately what percent more or less than the total females of west Bengal who were awarded?
    A. 8.7% more B. 8.7% less C. 7.3% more D. 12% less E. 5.3% more

Answer: Option D
Solution:
Total Females of MP who were awarded
= [latex] \frac{1} {3}[/latex] x 228 = 76
Total females of west Bengal who were awarded
= [latex] \frac{2} {3}[/latex] x 123 = 82
∴ Required answer = [latex] \frac{82 - 76} {82}[/latex] x 100 ≃ 7.3% less
Q4. Find the average no. of persons who were awarded for their bravery and intelligence in states UP, MP and Kerala together.
    A. 291 B. 289 C. 391 D. 301 E. 281

Answer: Option A
Solution:
Required average = [latex] \frac{1} {3}[/latex] x ((542 + 228 + 103) = 291
Q5. What is the difference between total no. of person who were awarded in states UP, Kerala and West Bengal together and total no. of persons who were awarded in MP, Maharashtra and Haryana together?
    A. 246 B. 264 C. 268 D. 260 E. 272

Answer: Option B
Solution:
Required difference = |(542 + 103 + 123) − (228 + 453 + 351)| = 264
Directions (1-5):The following bar graph shows the percentage of foreigner tourists of different age group from five different countries who visited the Red fort of India in 2016. The total no. of visitors is also mentioned with each country. Study the bar graph carefully to answer the questions that follow.

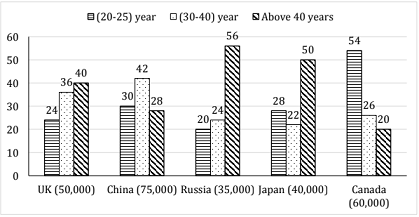
Q1. Find the average no. foreigner tourists of age groups (30-40) years from all countries together.
    A. 16,640 B. 16,460 C. 14,460 D. 18,460 E. 16,040

Answer: Option B
Solution:
Required average = [latex] \frac{1} {5}[/latex] x (36 × 500 + 42 × 750 + 24 × 350 + 22 × 400 + 26 × 600)
= [latex] \frac{1} {5}[/latex] x 82,300
= 16,460
Q2. Total no. of foreigner tourists of age group (20-25) years from UK and Russia together is what percent more or less than the total no. of foreigner tourists of age group (20-25) years from China and Japan together who visited the Red fort (approximately)?
    A. 44% B. 40% C. 34% D. 54% E. 47%

Answer: Option A
Solution:
Total no. of foreigner visitors from UK and Russia of age group (20–25) years
= [latex] \frac{24} {100}[/latex] x 50000 + [latex] \frac{20} {100}[/latex] x 35000
= 19,000
Total no. of foreigner visitors from China and Japan of age group (20–25) years
[latex] \frac{30} {100}[/latex] x 75000 + [latex] \frac{28} {100}[/latex] x 40000
= 33,700
Required percentage
[latex] \frac{33700 - 19000} {33,700}[/latex] x 100
≃ 44%
Q3. Find the total no. of foreigner tourists of age group above 40 years who visited the Red fort from all the countries together.
    A. 94,200 B. 94,600 C. 90,600 D. 92,600 E. 96,200

Answer: Option D
Solution:
Required answer
= (40 × 500 + 28 × 750 + 56 × 350 + 50 × 400 + 20 × 600)
= 92,600
Q4. What is the ratio of no. of foreigner tourists of age group (30–40) years who visited the Red fort from China and Japan together to the total no. of foreigner tourists of same age group from Russia and Canada together who visited the Red fort?
    A. 203 : 240 B. 240 : 403 C. 403 : 240 D. 240 : 203 E. None of these

Answer: Option C
Solution:
Required ratio = [latex] \frac{42 × 750 + 22 × 400} {24 × 350 + 26 × 600}[/latex]
= [latex] \frac{40,300} {24,000}[/latex]
= [latex] \frac{403} {240}[/latex]
Q5. If 20% foreigner tourists from each country also visited the India gate then find the total no. of those foreigner tourists who visited only Red fort.
    A. 20.8 lac B. 2.08 lac C. 1.08 lac D. 3.08 lac E. 2.008 lac

Answer: Option B
Solution:
Required answer = [latex] \frac{80} {100}[/latex] x (50,000 + 75,000 + 35,000 + 40,000 + 60,000)
= 2,08,000
Directions (1-5): The bar graph shows the sales of six different car-manufacturers in 2016 (in thousand units) in India. The pie-chart shows the break-up of sales of Brand Mahindra in 2016 in different states of India.


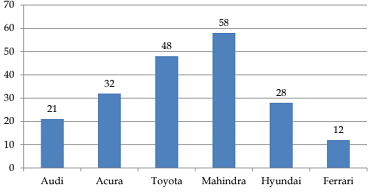
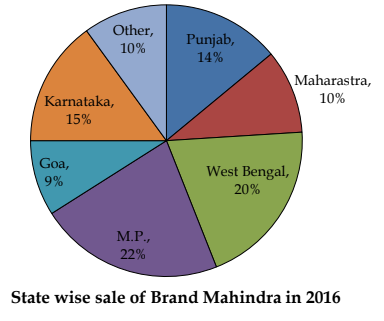
Q1. What is the difference between the sales of Mahindra in West Bengal and that in Goa?
    A. 50600 B. 6380 C. 6567 D. 6220 E. None of these

Answer: Option B
Solution:
Total sale of Mahindra cars in West Bengal
[latex] \frac{58} {100}[/latex] x 20 = 11.6 thousands = 11600
Total sale of Mahindra car in Goa = 58 x [latex] \frac{9} {100}[/latex]
= 5220
Required difference = 11600 – 5220 = 6380
Q2. By what percent should the sales of brand Mahindra is increased so that it sales volume in Punjab becomes 15000, while the volume of sales in all other state remains the same (approximately)
    A. 10% B. 9% C. 7% D. 13% E. 12%

Answer: Option E
Solution:
Sales of Mahindra cars in Punjab = [latex] \frac{58} {100}[/latex] x 14
= 8.12 thousands = 8120
Increase in volume = 15000 – 8120 = 6880
Percentage increase = [latex] \frac{6880} {58000}[/latex] × 100 ≈ 12%
Q3. If in 2017, the total sale of Brand Mahindra increases by 12%, while its sale in Maharashtra is increased by 34% and in M.P. by 22%, what is the approximate sales increase in the rest of the states together?
    A. 7000 B. 6500 C. 2180 D. 10,000 E. 12500

Answer: Option C
Solution:
Total sale of Mahindra in 2017 = [latex] \frac{112} {100}[/latex] x 58,000
= [latex] \frac{56 x 29} {25}[/latex] x 1000
= 64960
New total sale in Maharashtra = [latex] \frac{134} {100}[/latex] x [latex] \frac{10} {100}[/latex] x 58000
= 7772
New total sale in M.P. = [latex] \frac{122} {100}[/latex] x [latex] \frac{22} {100}[/latex] x 58000
≈ 15567
Total new sale in these states = 23339
Previous overall sale in all state except M.P. and Maharashtra
= [latex] \frac{68} {100}[/latex] x 58000
= 39440
Required increase in sale in other states
= (64960 – 23339) – 39440 ≈ 2180
Q4. Total sale of Audi, Acura and Toyota in 2016 is what percent of the total sales of Mahindra in all states together in that year, 2016. (approximately)
    A. 100% B. 113% C. 190% D. 175% E. 150%

Answer: Option D
Solution:
Required % = [latex] \frac{101} {58}[/latex] x 100
≈ 175%
Q5. If total sale of all brands together increases by 20% in 2017 and sale of Mahindra in West Bengal increase by 10% keeping % percentage distribution of Mahindra in these seven states same as previous then, what is the total sale of all cars in 2017 of all brands except brand Mahindra.
    A. 1,75,000 B. 1,50,000 C. 2,00,000 D. 1,00,000 E. None of these

Answer: Option A
Solution:
Net total sale = [latex] \frac{120} {100}[/latex] x 19900 = 238800
New sale of Mahindra in West Bengal = [latex] \frac{110} {100}[/latex] x [latex] \frac{20} {100}[/latex] x 58000
= 12760
New total sale of Mahindra = [latex] \frac{12760} {20}[/latex] x 100 = 63800
Required total sale = 238800 – 63800 = 1,75,000
Directions (1-5): The following table shows the number of persons who got injured in earthquake from five different states of India during five different years. Study the table carefully to answer the following questions.

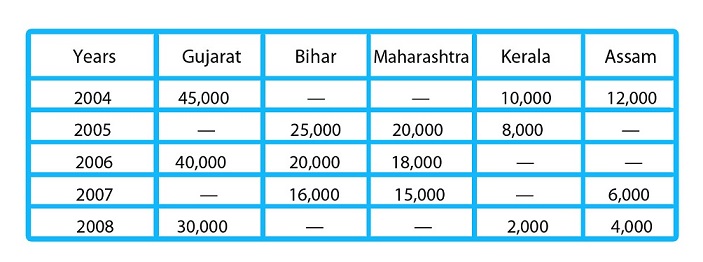
Q1. If total no. of person in Maharashtra who injured due to earthquake in 2004 was 150% more than the total no. of person from same state who injured in earthquake in 2008, then the total no. of person who injured in earthquake in 2005 in Maharashtra is what percent of total no. of persons who injured in 2008 in same state (It is given that total persons who injured in earthquake in Maharashtra throughout all the years is 88,000)?
    A. 190% B. 210% C. 200% D. 150% E. 250%

Answer: Option C
Solution:
Let no. of person who injured in Maharashtra in 2004 was x
∴ No. of persons who injured in same state in 2008 = [latex] \frac{100} {250}[/latex] × x
= [latex] \frac{2x} {5}[/latex]
x + [latex] \frac{2x} {5}[/latex] = 88,000 - (20,000 + 18,000 + 15,000) = 35,000
⇒ x = 25,000
[latex] \frac{2x} {5}[/latex] = [latex] \frac{2} {5}[/latex] x 25000 = 10,000
∴ Required percentage = [latex] \frac{20000} {10000}[/latex] x 100 = 200%
Q2. Total no. of person who injured in earthquake in Bihar and Maharashtra together in the year 2005 is what percent more or less than that from Gujarat and Bihar together in 2006?
    A. 25% more B. 25% less C. 20% less D. 20% more E. 30% less

Answer: Option B
Solution:
Total persons injured in earthquake from Bihar and Maharashtra together in 2005
= 25000 + 20000 = 45,000
Total person injured in earthquake from Gujarat and Bihar together in 2006
= 40,000 + 20,000 = 60,000
Required percentage = [latex] \frac{60000-45000} {45000}[/latex] x 100
25% less
Q3. If difference between the no. of person who injured in earthquake in Gujarat and Assam together in 2005 is 32,000 and total no. of persons who injured in earthquake in Assam was 25% more than that in Kerala in 2005 then find the total no. of persons who were injured in 2005 due to earthquake in all the states together?
    A. 1,05,000 B. 1,50,000 C. 1,10,000 D. 95,000 E. 1,15,000

Answer: Option A
Solution:
No. of persons in Assam who injured in earthquake in 2005 = 8000 x [latex] \frac{125} {100}[/latex] = 10,000
∴ persons injured in Gujarat in 2005 = 32,000 + 10,000 = 42,000
∴ Required answer = 42,000 + 25,000 + 20,000 + 8,000 + 10,000 = 1,05,000
Q4. If 32%, 24% and 18% persons out of total injured persons in state Gujarat, Bihar and Maharashtra respectively died in the year 2006, then find the total no. of person from these three states together who are still alive.
    A. 54,160 B. 55,160 C. 58,160 D. 57,160 E. 49,260

Answer: Option B
Solution:
Total number of professors = [latex] \frac{1} {9}[/latex] x [latex] \frac{9} {25}[/latex] x 375 = 15
Q5. If ratio between total no. of persons who were injured in earthquake in states Bihar and Maharashtra in the year 2008 is 5 : 4 and total person who injured in 2008 from all states is 63,000 then total person who injured in 2008 in Bihar and Maharashtra together is what percent of total person who injured in 2008 from all states together?
    A. [latex] \frac{400} {7}[/latex]% B. [latex] \frac{300} {7}[/latex]% C. [latex] \frac{200} {7}[/latex]% D. [latex] \frac{100} {7}[/latex]% E. [latex] \frac{500} {7}[/latex]%

Answer: Option C
Solution:
Let total person injured in earthquake in Bihar and Maharashtra is 5x and 4x respectively.
∴ 9x = 63,000 – (30,000 + 2,000 + 4,000) ⇒ 9x = 27,000
Required percentage = [latex] \frac{27,000} {60,000}[/latex] x 100 = [latex] \frac{300} {7}[/latex]%
= 42[latex] \frac{6} {7}[/latex]%
Directions (1-5): Study the following graph carefully and answer the questions given below

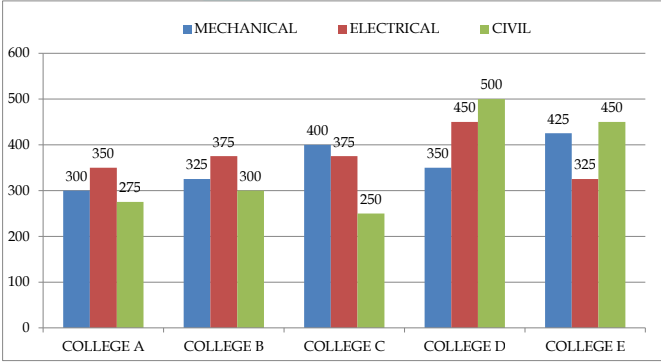
Number of students enrolled in mechanical, electrical and civil branches of five different colleges in the year 2016
Q1. Ratio of number of male to female students in electrical discipline from college B is 16: 9 and total professors in same college and in same branch is [latex] \frac{100} {9}[/latex]% of total female students from the same branch and same college then, find total number of professor in electrical branch from college B.
    A. 18 B. 15 C. 20 D. 22 E. 25

Answer: Option B
Solution:
Total number of professors = [latex] \frac{1} {9}[/latex] x [latex] \frac{9} {25}[/latex] x 375
= 15
Q2. If number of male student in civil branch from college D and male students in mechanical branch from college A are equal then what is the percentage of female students in mechanical branch of college A? Give that ratio of male to female students in civil branch from college D is 13: 12.
    A. [latex] \frac{100} {3}[/latex]% B. 16[latex] \frac{2} {3}[/latex] C. [latex] \frac{40} {3}[/latex]% D. [latex] \frac{22} {7}[/latex] E. None of these

Answer: Option C
Solution:
Number of male students in Mechanical branch from college A = [latex] \frac{13} {25}[/latex] x 500
= 260
Required percentage = [latex] \frac{300 - 260} {300}[/latex] x 100
= [latex] \frac{40} {3}[/latex]%
= 13[latex] \frac{1} {3}[/latex]%
Q3. If 20% of students in civil branch from college E are transferred to civil branch of college C then find the ratio of students in civil from college C to the total students from college E now.
    A. [latex] \frac{34} {111}[/latex] B. [latex] \frac{23} {322}[/latex] C. [latex] \frac{23} {111}[/latex] D. [latex] \frac{34} {113}[/latex] E. None of these

Answer: Option A
Solution:
20% students from civil branch in college E = [latex] \frac{20} {100}[/latex] x 450 = 90
Total students of civil branch in college C = 250 + 90 = 340
Required ratio = [latex] \frac{340} {1100}[/latex]
= [latex] \frac{340} {111}[/latex]
Q4. Average of students in electrical branch from all colleges are what percent less/more than the average students in Civil branch from all colleges together? (Approximately)
    A. 12% B. 10% C. 4% D. 9% E. 6%

Answer: Option E
Solution:
Total students in Electrical branch in all college = 350 + 375 + 375 + 450 + 325 = 1875
Total students in civil branch from all colleges = 275 + 300 + 250 + 500 + 450 = 1775
Required percentage = [latex] \frac{375 - 355} {355}[/latex] x 100
= 5.6% ~ 6% more
Q5. If 20% of total students from College D, are failed in yearly exam, 75% of total students are passed from college E in yearly exams then what will be total students in college D and E together in year 2017 if 400 more students are enrolled in 2017 from both colleges D and E together (consider both colleges were opened in 2016 and enrollment is cancelled when a student fails in exam).
    A. 2340 B. 2900 C. 2440 D. 2800 E. 2250

Answer: Option A
Solution:
Total students in college D and E together in 2017 who are enrolled now are
= 1300[latex] \frac{80} {100} [/latex] + 1200 x [latex] \frac{75} {100} [/latex] + 400
= 2340
Directions (1-5): The table given below provides the percentage of number of students from 5 different colleges who got placed in various companies during campus placement in year 2016. It was recorded that all students from all colleges got placed.

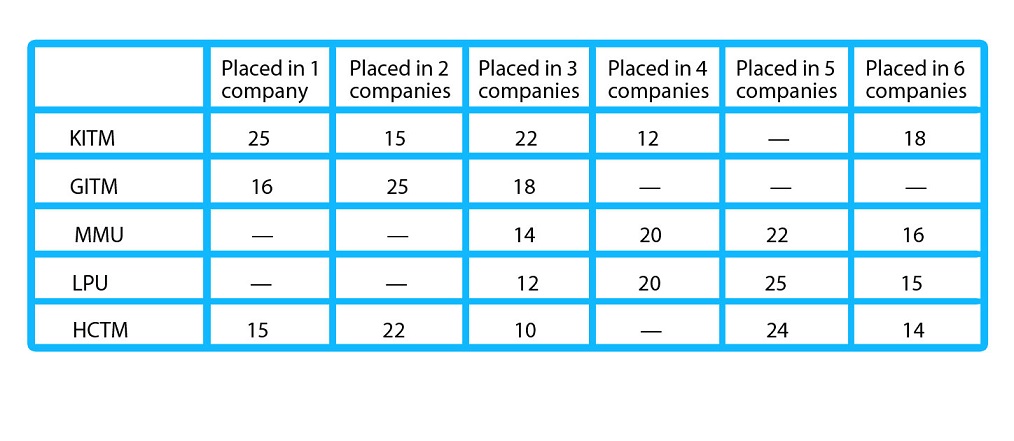
Q1. In KITM, 320 students were placed in at most 2 companies, which is 136 less than the number of students in HCTM who were placed in at least 5 companies. Find the ratio of total number of students in KITM and HCTM.
    A. 3 : 5 B. 4 : 11 C. 2 : 3 D. 2 : 5 E. 3: 4

Answer: Option C
Solution:
Students placed in at most 2 companies = 40% = 320
∴ Total number of students in KITM = [latex] \frac{320} {40} [/latex] x 100 = 800
Students placed in at least 5 companies in HCTM = 320 + 136 = 456 which is equal to 38%
∴ Total students in HCTM = [latex] \frac{456} {38} [/latex] x 100
∴ Required ratio = [latex] \frac{800} {1200} [/latex] = 2 : 3
Q2. Find the difference in number of students who were placed in at least 4 companies and that of in at least 3 companies in college LPU if its total strength is 850.
    A. 105 B. 201 C. 160 D. 102 E. 120

Answer: Option D
Solution:
Students placed in at least 4 companies = [latex] \frac{60} {100} [/latex] x 850
Students placed in at least 3 companies = [latex] \frac{72} {100} [/latex] x 850 = 612
∴ Required difference = 102
Q3. Which college records the maximum number of students who were placed in at least 4 companies provided that the strength of students in each college is 1500?
    A. LPU B. GITM C. MMU D. HCTM E. KITM

Answer: Option A
KITM = 38%
GITM = 41%
MMU = 58%
LPU = 60%
HCTM = 53%
∴ Required answer is LPU
Q4. Total number of students placed in 5 companies in KITM is same as that of in HCTM. If 135 students of HCTM were placed in 1 company, then find total strength of KITM.
    A. 2750 B. 2680 C. 2700 D. 2500 E. None of these

Answer: Option C
Solution:
Students placed in 5 companies in HCTM = [latex] \frac{135} {15} [/latex] × 24 = 216
∴ Total students in KITM = [latex] \frac{216} {8} [/latex] x 100 = 2700
Q5. LPU and MMU both has total strength of 1600 students each
    A. 448 B. 488 C. 484 D. 450 E. 438

Answer: Option A
Solution:
Required average = [latex] \frac{1} {2} [/latex](28 + 28) X [latex] \frac{1600} {100} [/latex]
= 448
Directions (1-5): The following pie-chart show the number of sun glasses (in percentage) sold by two companies Reebok and Adidas during the year 2016-17 in six different countries. Study the graph carefully and answer the related questions.

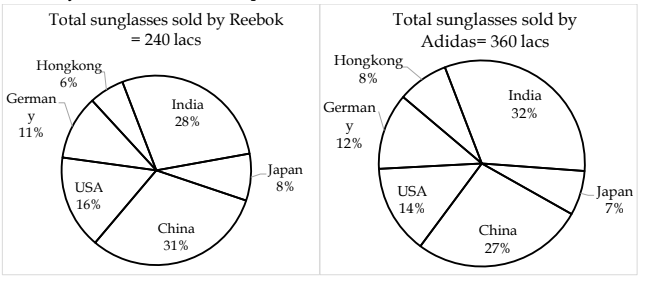
Q1. Total number of Reebok sunglasses sold in India are approximately what percent more or less than the total number of Adidas sun glasses sold in China?
    A. 31% more B. 31% less C. 27% less D. 27% more E. 23% less

Answer: Option B
Solution:
Required percentage [latex] \frac{|27 × 360– 28 × 240|} {27 × 360} [/latex] x 100
= [latex] \frac{3000} {27 × 360} [/latex] x 100
= [latex] \frac{2500} {81} [/latex]
≃ 31% less
Q2. What is the difference between sun glasses sold in China, USA and Hongkong together by Reebok and Adidas?
    A. 47.2 lacs B. 42.9 lacs C. 4.92 lacs D. 43.8 lacs E. 49.2 lacs

Answer: Option E
Solution:
Required difference = (27 + 14 + 8) % of 360 - (31 + 16 + 6) % of 240
= 176.4 - 127.2 = 49.2 lacs
Q3. Total number of Adidas sunglasses sold in Japan and Germany together is what percent of Reebok sunglasses sold in the same countries together?
    A. 150% B. 180% C. 300% D. 100% E. 250%

Answer: Option A
Solution:
Total no. of Adidas sunglasses sold in Germany and Japan together
= [latex] \frac{19} {100} [/latex] x 360
= 68.4 lacs
And that of Reebok
= [latex] \frac{19} {100} [/latex] x 240
= 45.6 lacs
∴ Required percentage = [latex] \frac{68.4} {48.6} [/latex] x 100
= 150%
Q4. If ratio of selling price per item of Reebok sunglass and Adidas sunglasses in India is 5: 3 and total profit earned by Reebok from India was 66 [latex] \frac{2} {3} [/latex] % then find the ratio of cost price of Reebok and Adidas in India.
    A. 3: 5 B. 2: 3 C. can’t be determined D. 3: 4 E. None of these

Answer: Option C
Solution:
Let selling price per item of Reebok and Adidas in India is 5x and 3x respectively. Since, here we know only profit of Reebok sun glasses and we have no information about profit of Adidas sun glasses.
So, answer can’t be found.
Q5. What is the average number of Adidas sunglasses sold in countries China, USA, Hongkong and Japan together.
    A. 5.04 lacs B. 50.4 lacs C. 60.4 lacs D. 40.6 lacs E. 48.4 lacs

Answer: Option B
Solution:
Required average = [latex] \frac{1} {4} [/latex] x [latex] \frac{(27 + 14 + 8 + 7) × 360} {100} [/latex]lacs
= 50.4 lacs
Directions (1-5): Study the following pie chart and bar graph carefully and answer the questions given below:


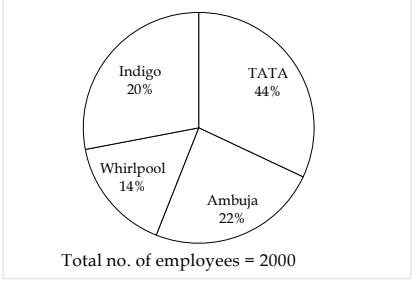
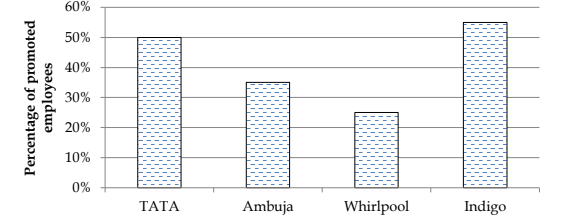
The pie-chart shows the percentage of employees working in four different companies and the bar graph shows the percentage of employees promoted in these companies.
Q1. What is the total number of promoted employees in Whirlpool and Ambuja together?
    A. 250 B. 224 C. 235 D. 228 E. 244

Answer: Option B
Solution:
Required total number of promoted employees
= ([latex] \frac{14} {100} [/latex] x 2000 x [latex] \frac{25} {100} [/latex] + [latex] \frac{35} {100} [/latex] x [latex] \frac{22} {100} [/latex] x 2000)
= 224
Q2. What is the difference between the number of promoted employees in TATA and Ambuja together to the number of un-promoted employees working in Whirlpool and Indigo together?
    A. 215 B. 220 C. 204 D. 202 E. 256

Answer: Option C
Solution:
Required difference = ([latex] \frac{44} {100} [/latex] x 2000 x [latex] \frac{50} {100} [/latex] + [latex] \frac{22} {100} [/latex] x 2000 x [latex] \frac{35} {100} [/latex]) - ([latex] \frac{14} {100} [/latex] x 2000 x [latex] \frac{75} {100} [/latex] + [latex] \frac{20} {100} [/latex] x 2000 x [latex] \frac{45} {100} [/latex])
= 594 − 390 = 204
Q3. What is the ratio of the number of employees promoted in Ambuja & TATA together to the total number of employees working in Whirlpool?
    A. [latex] \frac{297} {40} [/latex] B. [latex] \frac{285} {142} [/latex] C. [latex] \frac{305} {243} [/latex] D. [latex] \frac{281} {11} [/latex] E. None of these

Answer: Option A
Solution:
Required ratio = [latex] \frac{22/100 × 35/100 + 44/100 × 50/100 × 2000} {14/100 × 2000}[/latex]
= [latex] \frac{29.7} {14} [/latex]
= [latex] \frac{297} {14} [/latex]
Q4. What is the average number of un-promoted employees from all the four companies together?
    A. 255 B. 305 C. 285 D. 279 E. 384

Answer: Option D
Solution:
Average number of un-promoted employees from all the four companies = [latex] \frac{1} {4} [/latex] x ([latex] \frac{44} {100} [/latex] x[latex] \frac{50} {100} [/latex] + [latex] \frac{22} {100} [/latex] x [latex] \frac{65} {100} [/latex] + [latex] \frac{14} {100} [/latex] x [latex] \frac{75} {100} [/latex] + [latex] \frac{20} {100} [/latex] x [latex] \frac{45} {100} [/latex]) x 2000
= [latex] \frac{1} {4} [/latex] x [latex] \frac{(2,200 + 1,430 + 1,050 + 900) × 2} {100} [/latex]
Q5. The number of promoted employees working in Indigo and Whirlpool together is approximately what percent of the total number of employees working in Ambuja and TATA together?
    A. 33% B. 35% C. 31% D. 25% E. 22%

Answer: Option E
Solution:
Number of promoted employees in Indigo and Whirlpool together
= ([latex] \frac{20} {100} [/latex] x [latex] \frac{55} {100} [/latex] + [latex] \frac{14} {100} [/latex] x [latex] \frac{25} {100} [/latex]) x 2000
Total employees in Ambuja and TATA together
= ([latex] \frac{22} {100} [/latex] x [latex] \frac{44} {100} [/latex] x 2000
= 1,320
∴ Required percentage
= [latex] \frac{290} {1330} [/latex] x 100
= 21.969 ≃ 22% (approx)