Quantitative Aptitude - SPLessons

IBPS PO Data Analysis & Interpretation Quiz 3

Home > > Tutorial
SPLessons 5 Steps, 3 Clicks
5 Steps - 3 Clicks

IBPS PO Data Analysis & Interpretation Quiz 3

shape Introduction

Data Interpretation is the ability to analyze, interpret and visualize the provided data to arrive at conclusions and to make inferences. Data Interpretation questions in the competitive exams is a test of analytical abilities. In the competitive exams, the Data Interpretation questions are grouped together and refer to the same table, graph or other data/visual presentation. The test takers are required to interpret or analyze the given data to answer the questions. In India, competitive exams related to employment in Banking, SSC, Insurance etc..have the Data Interpretation type of questions.
The article IBPS PO Data Analysis & Interpretation Quiz 3 provides Important Data Analysis & Interpretation Multiple choice questions useful to the candidates preparing IBPS PO Mains, Insurance and Bank Exams 2019.

shape Quiz

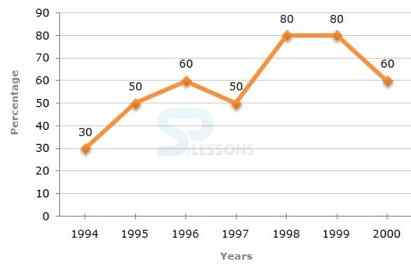
Directions (1-5): The following line graph gives the percentage of the number of candidates who qualified an examination out of the total number of candidates who appeared for the examination over a period of seven years from 1994 to 2000.
Percentage of Candidates Qualified to Appeared in an Examination Over the Years

1. The difference between the percentage of candidates qualified to appeared was maximum in which of the following pairs of years?
    A. 1994 and 1995 B. 1997 and 1998 C. 1998 and 1999 D. 1999 and 2000

2. In which pair of years was the number of candidates qualified, the same?
    A. 1995 and 1997 B. 1995 and 2000 C. 1998 and 1999 D. Data inadequate

3. If the number of candidates qualified in 1998 was 21200, what was the number of candidates appeared in 1998?
    A. 32000 B. 28500 C. 26500 D. 25000

4. If the total number of candidates appeared in 1996 and 1997 together was 47400, then the total number of candidates qualified in these two years together was?
    A. 34700 B. 32100 C. 31500 D. Data inadequate

5. The total number of candidates qualified in 1999 and 2000 together was 33500 and the number of candidates appeared in 1999 was 26500. What was the number of candidates in 2000?
    A. 24500 B. 22000 C. 20500 D. 19000

Answers and Explanations
1. Answer - Option B
Explanation -
The differences between the percentages of candidates qualified to appeared for the give pairs of years are:
For 1994 and 1995 = 50 - 30 = 20.
For 1998 and 1999 = 80 - 80 = 0.
For 1994 and 1997 = 50 - 30 = 20.
For 1997 and 1998 = 80 - 50 = 30.
For 1999 and 2000 = 80 - 60 = 20.
Thus, the maximum difference is between the years 1997 and 1998.
2. Answer - Option D
Explanation -
The graph gives the data for the percentage of candidates qualified to appeared and unless the absolute values of number of candidates qualified or candidates appeared is know we cannot compare the absolute values for any two years.
Hence, the data is inadequate to solve this question.
3. Answer - Option C
Explanation -
The number of candidates appeared in 1998 be x.
Then, 80% of x = 21200 [latex]\Rightarrow X = \frac {21200 \times 100}{80} = 26500[/latex]
4. Answer - Option D
Explanation -
The total number of candidates qualified in 1996 and 1997 together, cannot be determined until we know at least, the number of candidates appeared in any one of the two years 1996 or 1997 or the percentage of candidates qualified to appeared in 1996 and 1997 together.
Hence, the data is inadequate.
5. Answer - Option C
Explanation -
The number of candidates qualified in 1999 = (80% of 26500) = 21200.
Therefore Number of candidates qualified in 2000 = (33500 - 21200) = 12300.
Let the number of candidates appeared in 2000 be x.
Then, 60% of x = 12300 [latex] \Rightarrow x = (\frac {12300 \times 100}{60}) = 20500[/latex]
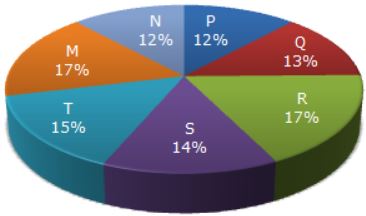
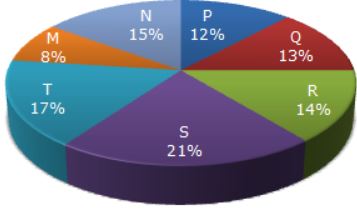
Directions (1 to 5): The following pie-charts show the distribution of students of graduate and post-graduate levels in seven different institutes in a town.
Distribution of students at graduate and post-graduate levels in seven institutes:

Total Number of Students of Graduate Level = 27300


Total Number of Students of Post-Graduate Level = 24700


1. What is the total number of graduate and post-graduate level students is institute R?
    A. 8320 B. 7916 C. 9116 D. 8099

2. What is the ratio between the number of students studying at post-graduate and graduate levels respectively from institute S?
    A. 14 : 19 B. 19 : 21 C. 17 : 21 D. 19 : 14

3. How many students of institutes of M and S are studying at graduate level?
    A. 7516 B. 8463 C. 9127 D. 9404

4. What is the ratio between the number of students studying at post-graduate level from institutes S and the number of students studying at graduate level from institute Q?
    A. 13 : 19 B. 21 : 13 C. 13 : 8 D. 19 : 13

5. Total number of students studying at post-graduate level from institutes N and P is
    A. 5601 B. 5944 C. 6669 D. 8372

Answers and Explanations
1. Answer - Option D
Explanation -
Required number = (17% of 27300) + (14% of 24700)
= 4641 + 3458
= 8099.
2. Answer - Option D
Explanation -
Required ratio = [latex]\frac {(21% of 24700)}{(14% of 27300)} = \frac {(21 x 24700)}{14 x 27300} = \frac {19}{14} [/latex]
3. Answer - Option B
Explanation -
Students of institute M at graduate level= 17% of 27300 = 4641.
Students of institute S at graduate level = 14% of 27300 = 3822.
Therefore Total number of students at graduate in institutes M and S = (4641 + 3822)
= 8463.
4. Answer - Option D
Explanation -
Required ratio = [latex]\frac {(21% of 24700)}{(13% of 27300)} = \frac {(21 x 24700)}{13 x 27300} = \frac {19}{13} [/latex]
5. Answer - Option C
Explanation -
Required number = (15% of 24700) + (12% of 24700)
= 3705 + 2964
= 6669.
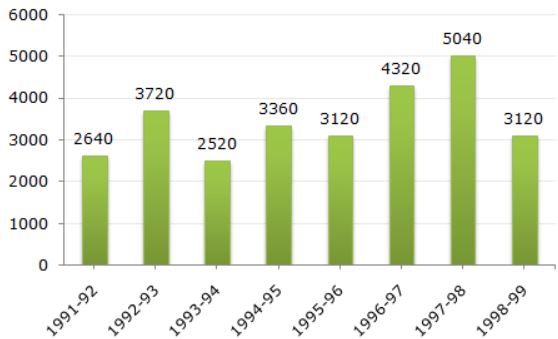
Directions (1 to 5): The bar graph given below shows the foreign exchange reserves of a country (in million US $) from 1991 - 1992 to 1998 - 1999.
Foreign Exchange Reserves Of a Country. (in million US $)


1. The ratio of the number of years, in which the foreign exchange reserves are above the average reserves, to those in which the reserves are below the average reserves is?
    A. 2:6 B. 3:4 C. 3:5 D. 4:4

2. The foreign exchange reserves in 1997-98 was how many times that in 1994-95?
    A. 0.7 B. 1.2 C. 1.4 D. 1.5

3. For which year, the percent increase of foreign exchange reserves over the previous year, is the highest?
    A. 1992-93 B. 1993-94 C. 1994-95 D. 1996-97

4. The foreign exchange reserves in 1996-97 were approximately what percent of the average foreign exchange reserves over the period under review?
    A. 95% B. 110% C. 115% D. 125%

5. What was the percentage increase in the foreign exchange reserves in 1997-98 over 1993-94?
    A. 100 B. 150 C. 200 D. 620

Answers and Explanations
1. Answer - Option C
Explanation -
Average foreign exchange reserves over the given period = 3480 million US $.
The country had reserves above 3480 million US $ during the years 1992-93, 1996-97 and 1997-98, i.e., for 3 years and below 3480 million US $ during the years 1991-92, 1993-94, 1994-95, 1995-56 and 1998-99 i.e., for 5 years.
Hence, required ratio = 3 : 5.
2. Answer - Option D
Explanation -
Required ratio = [latex]\frac {5040}{3360} = 1.5[/latex]
3. Answer - Option A
Explanation - There is an increase in foreign exchange reserves during the years 1992 - 1993, 1994 - 1995, 1996 - 1997, 1997 - 1998 as compared to previous year (as shown by bar-graph).
The percentage increase in reserves during these years compared to previous year are:
For 1992 - 1993 = [latex][\frac {(3720 - 2640)}{2640} \times 100] [/latex]% = 40.91%.
For 1994 - 1995 = [latex][\frac {(3360 - 2520) x 100}{2520}][/latex]% = 33.33%.
For 1996 - 1997 = [latex][\frac {(4320 - 3120) x 100}{3120}][/latex]% = 38.46%.
For 1997 - 1998 = [latex][\frac {(5040 - 4320) x 100}{4320}][/latex]% = 16.67%.
Clearly, the percentage increase over previous year is highest for 1992 - 1993.
4. Answer - Option D
Explanation -
Average foreign exchange reserves over the given period
= [latex][\frac {1}{8} \times (2640 + 3720 + 2520 + 3360 + 3120 + 4320 + 5040 + 3120)][/latex] million US $
= 3480 million US $.
Foreign exchange reserves in 1996 - 1997 = 4320 million US $.
Therefore Required percentage = [latex](\frac {4320}{3480} \times 100)[/latex]% = 124.14% = 125%.
5. Answer - Option A
Explanation -
Foreign exchange reserves in 1997 - 1998 = 5040 million US $.
Foreign exchange reserves in 1993 - 1994 = 2520 million US $.
Therefore Increase = (5040 - 2520) = 2520 US $.
Therefore Percentage Increase =[latex](\frac {2520}{2520} \times 100)[/latex]% = 100%.

Related Information
SSC CPO Percentages Quiz 4
Ayodhya Verdict 2019
Marketing Aptitude Quiz 59